


On Friday, May 16, 2025, after markets closed, Moody’s downgraded the United States’ credit rating, citing ballooning national debt.
The announcement sent ripples through financial circles, with some again proclaiming the end of American economic dominance.
But is this truly a harbinger of collapse, or just another chapter in a familiar story?
This isn’t the first time the U.S. debt rating has been cut…Standard & Poor’s did it in 2011, and Fitch followed in 2023.
Each time, doomsayers predicted catastrophe, yet markets defied these extreme expectations.
Let’s unpack what happened in the past, examine current market signals, and consider what might lie ahead, using historical context and technical indicators to ground our analysis.

A History of Downgrades: What Happened Last Time?
To understand the potential impact of Moody’s downgrade, we must first look at how markets reacted to previous downgrades.
In August 2011, Standard & Poor’s lowered the U.S. credit rating from AAA to AA+.
Conventional wisdom suggested this would trigger a sell-off in U.S. Treasuries, driving yields higher as investors demanded higher returns for perceived risk. Instead, the opposite occurred.
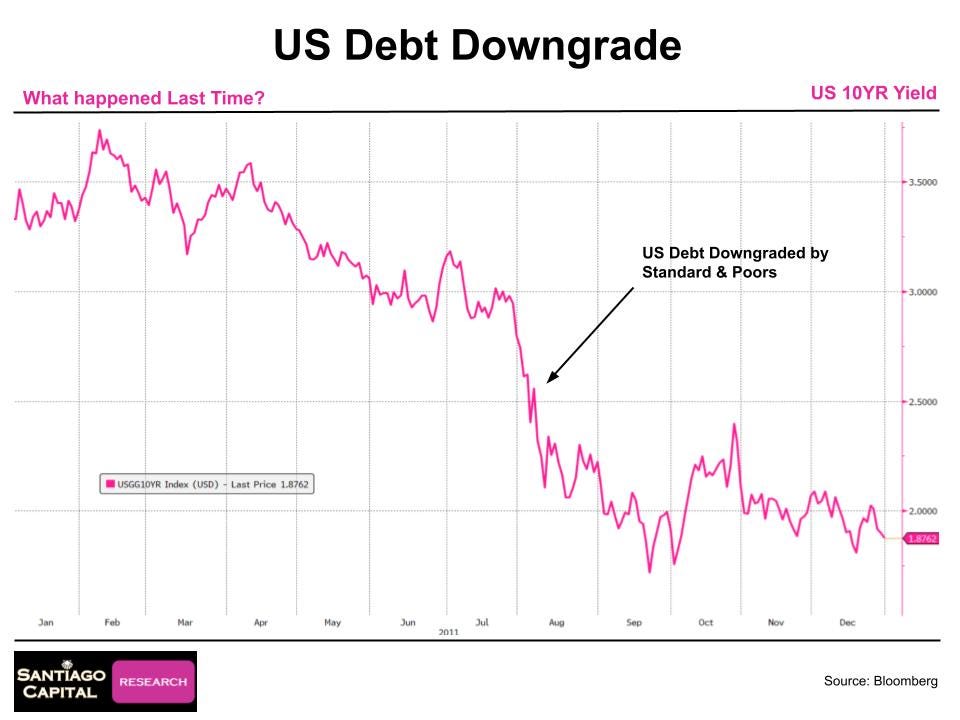
This chart shows the 10-year Treasury yield dropping significantly after the 2011 downgrade, from around 2.5% to below 2% within six months.
Treasury prices rallied as yields fell, reflecting sustained demand for U.S. debt despite the downgrade.
The U.S. dollar, measured by the DXY index, initially weakened but quickly recovered.
Within weeks, it embarked on a robust rally, gaining strength over the next six months.
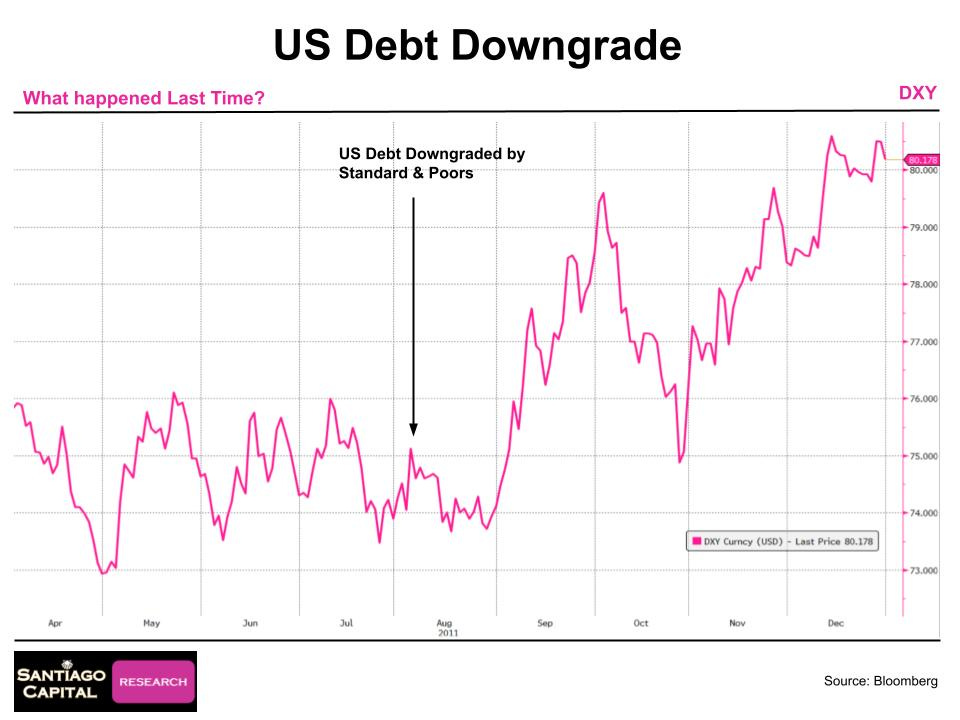
The DXY index, which tracks the dollar against a basket of major currencies, shows a sharp recovery post-downgrade, climbing from around 74 to above 80 by early 2012.
Equity markets, however, took a hit.
Global risk assets, including major U.S. indices like the S&P 500 and Nasdaq, sold off sharply in August 2011, with declines continuing into the fall before a partial recovery by year-end.
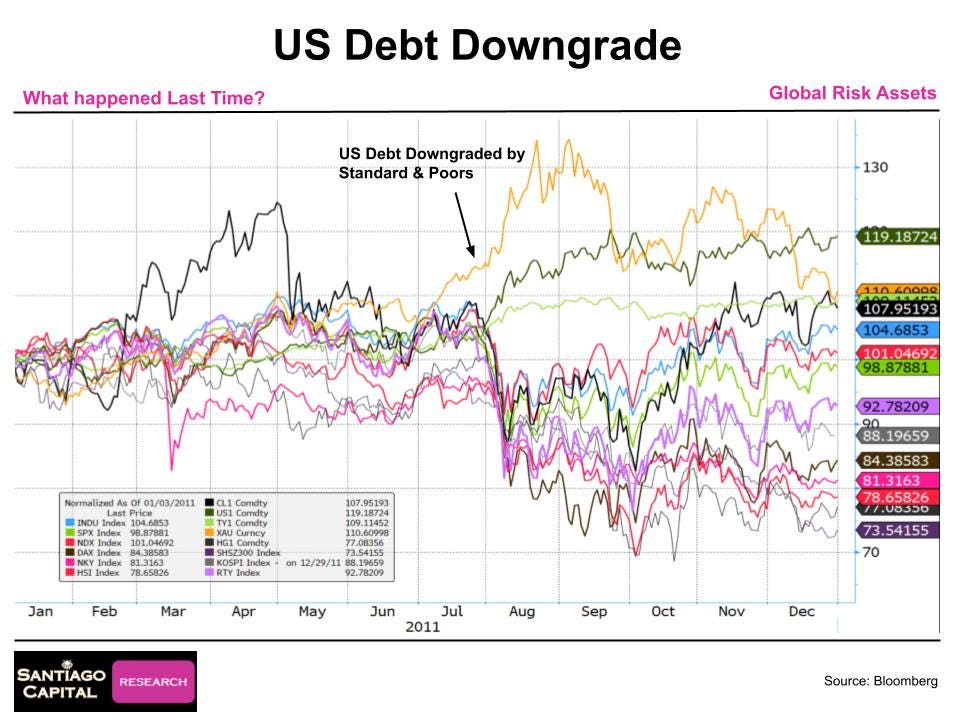
This slide illustrates the sell-off in risk assets, with indices like the S&P 500 (SPY) and Nasdaq (QQQ) dropping significantly post-downgrade.
Fast forward to August 2023, when Fitch downgraded U.S. debt.
This time, Treasury yields initially spiked, reflecting selling pressure, but the move was short-lived.
By year-end, yields returned to levels seen at the time of the downgrade.
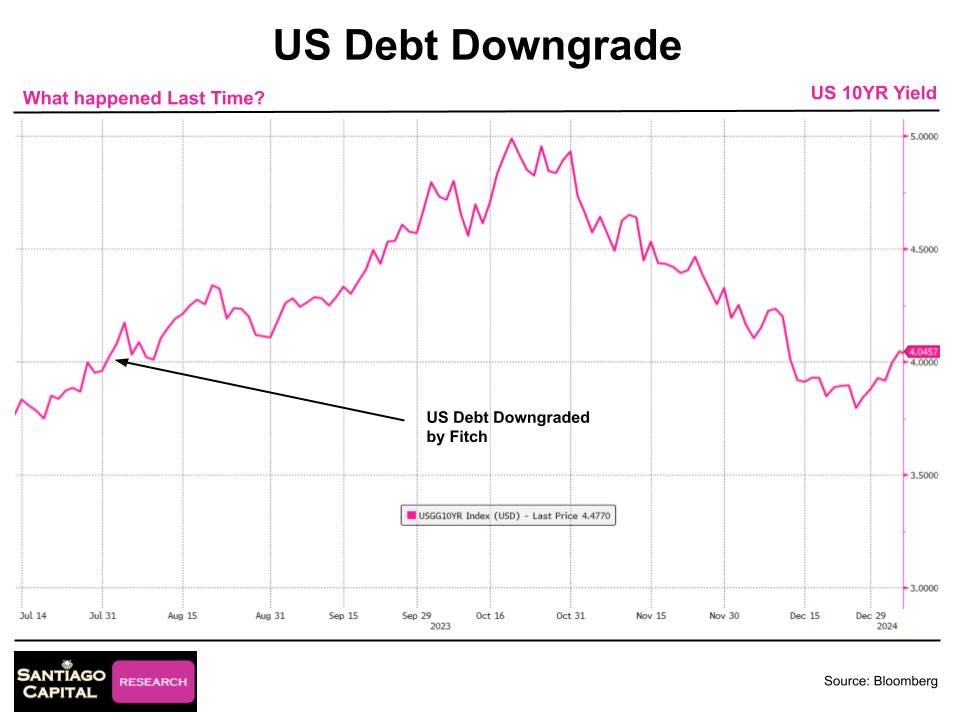
The 10-year yield rose briefly after the Fitch downgrade, peaking around 5%, but retreated to approximately 4% by December 2023.
The dollar, bolstered by rising yields, rallied initially but later softened as yields declined.
By spring-2024, the DXY was up roughly 5% from its pre-downgrade level.
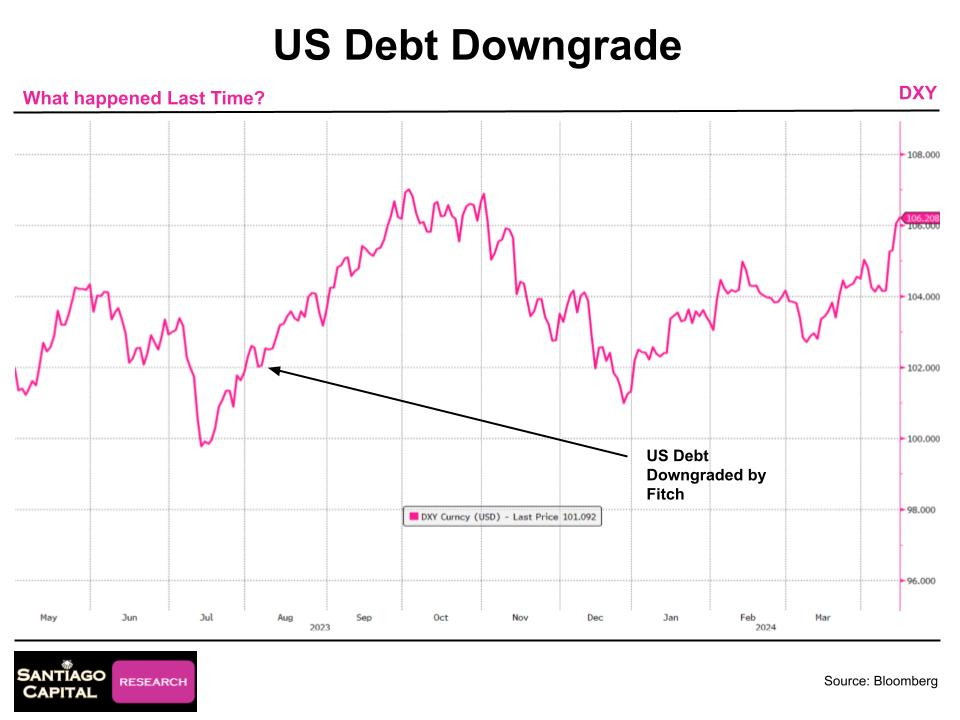
This chart shows the DXY’s volatility post-Fitch downgrade, with a peak near 106.5 in late September 2023 before settling around 103 by early 2024, then rallying back to 106 by April.
Risk assets followed a similar pattern to 2011, with a sell-off in August 2023, followed by a recovery toward year-end.
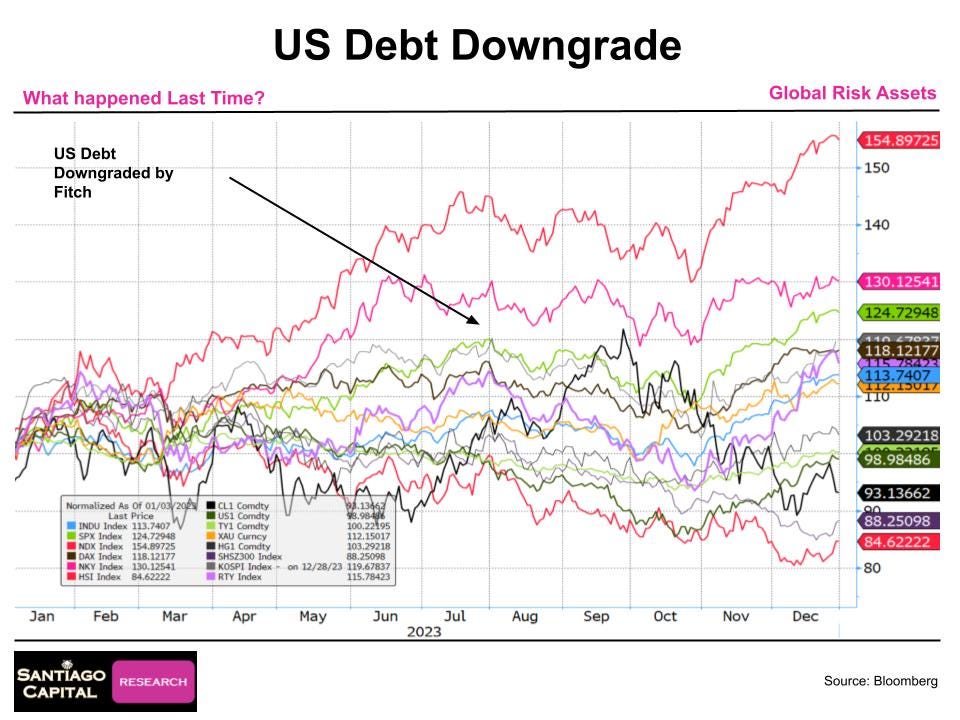
Major indices like the Dow (DIA) and Russell 2000 (IWM), declined post-downgrade but rebounded by late 2023.
These historical reactions suggest that debt downgrades don’t necessarily trigger the apocalyptic outcomes some predict.
Treasuries often remain a safe haven, the dollar tends to hold or gain value, and equities, while volatile, typically recover.
But past performance isn’t a guarantee…could this time be different?

The Milkshake Framework: Bonds, Equities, and the Dollar
The “Dollar Milkshake” theory provides a framework for understanding market dynamics during a sovereign debt crisis. A U.S. Debt downgrade does not invalidate this thesis, it supports it.
Because it posits that rising interest rates and falling bond prices could drive capital flows into U.S. equities and the dollar, even as global markets struggle.
This theory, articulated years ago, anticipated higher interest rates breaking the 40-year bond bull market, where fixed-income investors enjoyed consistent gains.
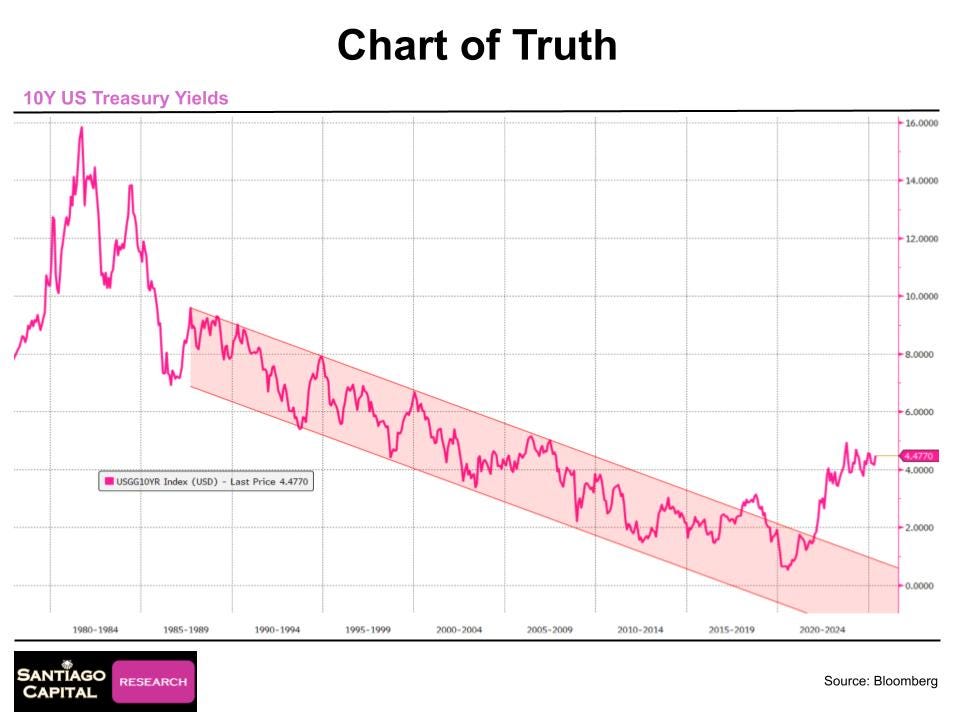
This chart, often called the “Chart of Truth,” shows the 10-year Treasury yield breaking out of a 40-year downtrend in 2021, climbing above 4% by 2025, signaling a structural shift to higher rates.
The theory suggested that as rates rise, bond prices would fall, shaking investor confidence in fixed income.
Because for 40 years, bonds were a reliable profit machine…buy and hold, and you’d make money. But now, with yields climbing over the last few years, bondholders faced losses for the first time in decades.
If it continues, this could trigger an emotional and financial reckoning, akin to a turkey’s rude awakening on Thanksgiving.
As funds exit bonds, one of the potential destinations is equities, which could then push stock indices to new highs, and into the dollar, strengthening it against other currencies.
Gold would also benefit as a hedge against uncertainty.
And these types of moves is exactly what we have seen over the last 4 years.
Importantly, the theory distinguishes between being bullish on Treasuries (expecting bond prices to rise) and bullish on the dollar (expecting USD strength).
Historically, these assets often move inversely…rising yields weaken bonds but bolster the dollar.
So if bonds are breaking, the dollar’s climbing, and equities are being force-fed liquidity…what does that mean for markets today?
The answer may lie in a single word: euphoria. Because even as cracks form under the surface, investors are partying like it’s 1999…
Current Market Signals: Frothy and Overbought
Moody’s downgrade comes at a time when markets are showing signs of exuberance.
Technical indicators across major asset classes suggest equities are overbought, sentiment is overly optimistic, and volatility is suppressed…conditions that often precede pullbacks.
The Dow Jones Industrial Average, S&P 500, Nasdaq, and Russell 2000 have rallied sharply since April 2025 lows, again nearing all-time highs.
Relative Strength Index (RSI) readings are approaching overbought levels (above 70), and stochastic oscillators are at or near the highs, indicating limited room for further gains without a pause.
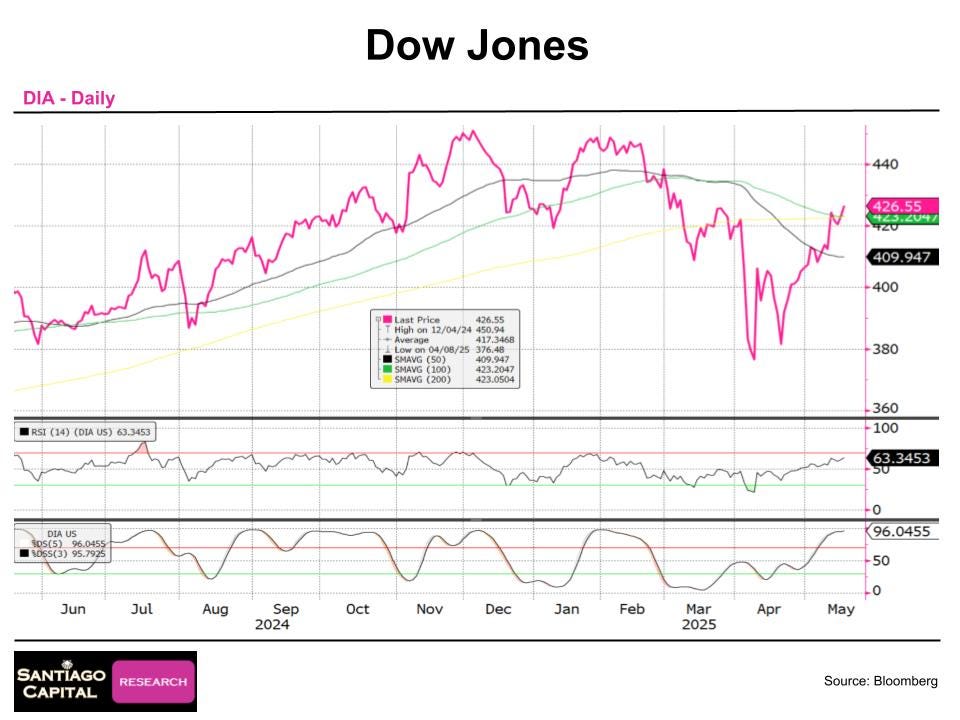
The Dow’s chart shows RSI nearing overbought territory and stochastics pushing the high 90s, with the 100-day moving average (green line) crossing below the 200-day (yellow line), a bearish signal.
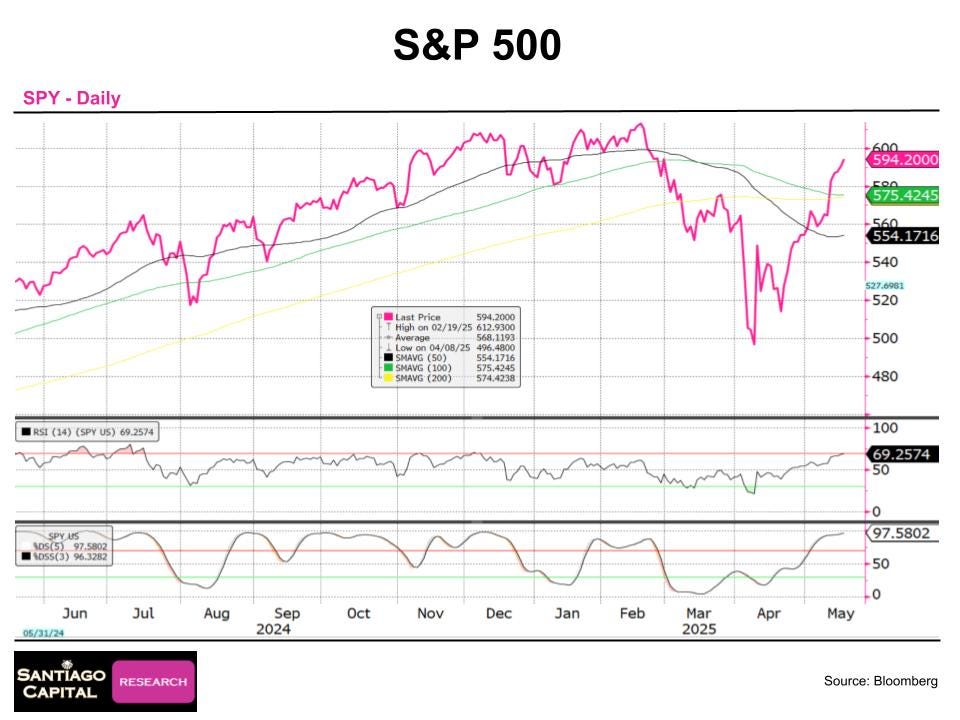
The S&P 500 mirrors this pattern, with RSI close to 70 and stochastics maxed out, suggesting a potential reversal.
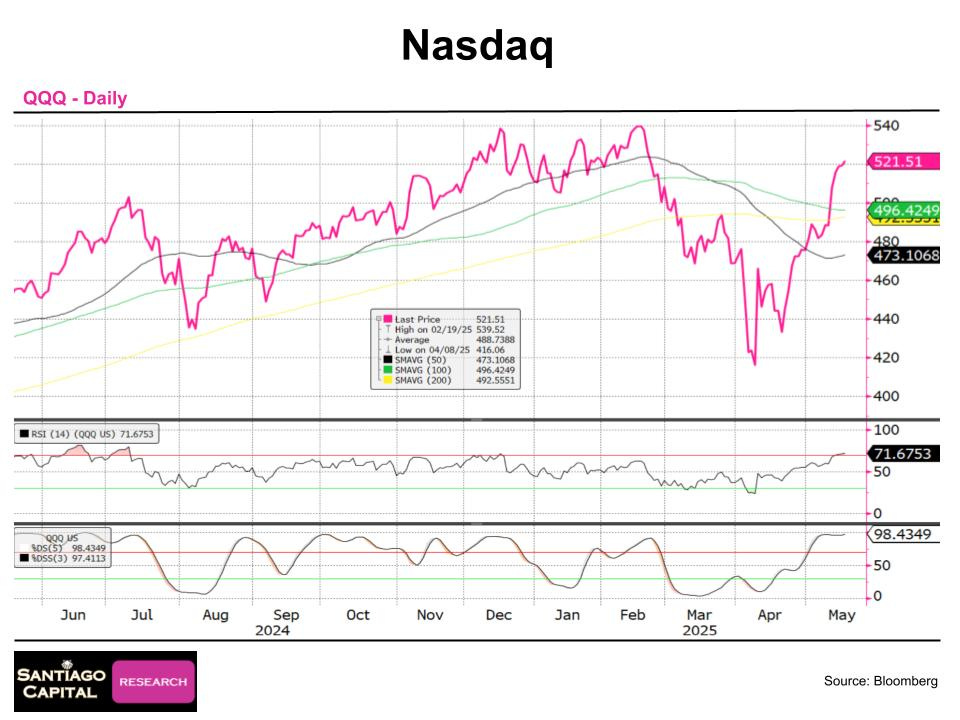
The Nasdaq is fully overbought, with RSI above 70 and stochastics at 98, reflecting tech sector euphoria.
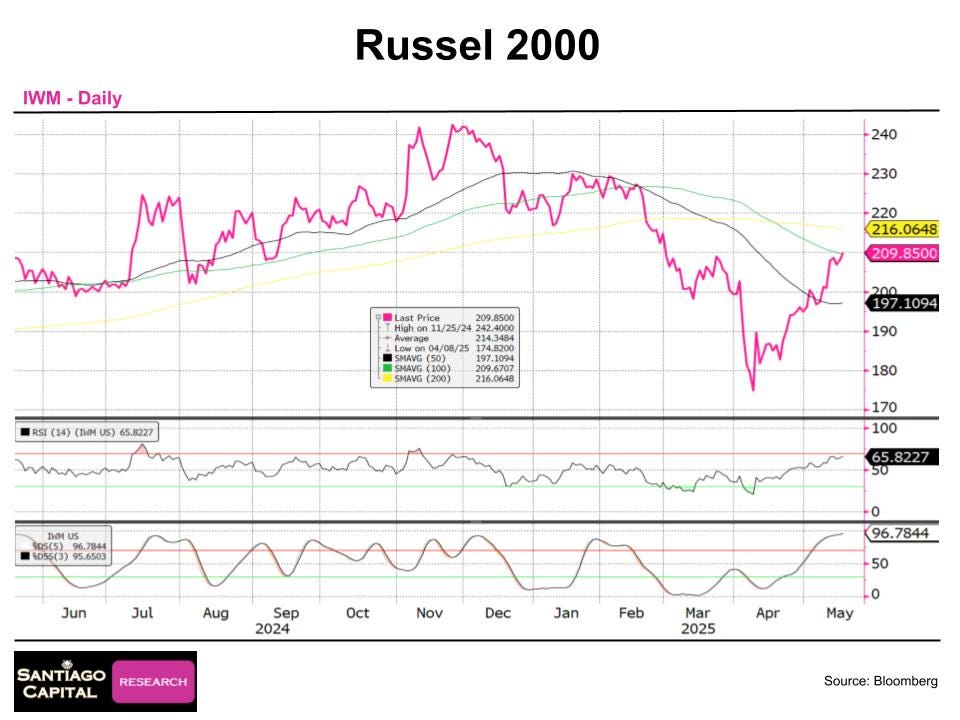
The Russell 2000, while not yet overbought, shows high stochastics and a sharp rally, indicating stretched valuations.
Tech giants like Microsoft and Nvidia, along with semiconductors, are particularly frothy. Microsoft’s RSI is back to levels seen at previous peaks, and Nvidia’s chart screams caution after a 35% surge in a month.
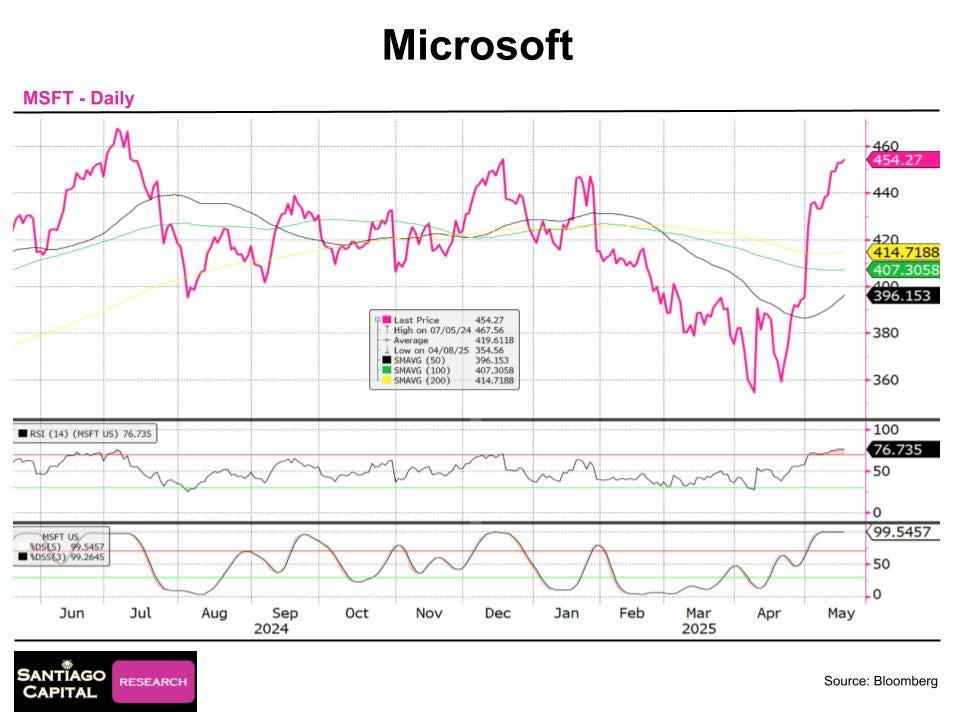
Microsoft’s RSI is overbought, matching January 2025 highs, with stochastics at 99.
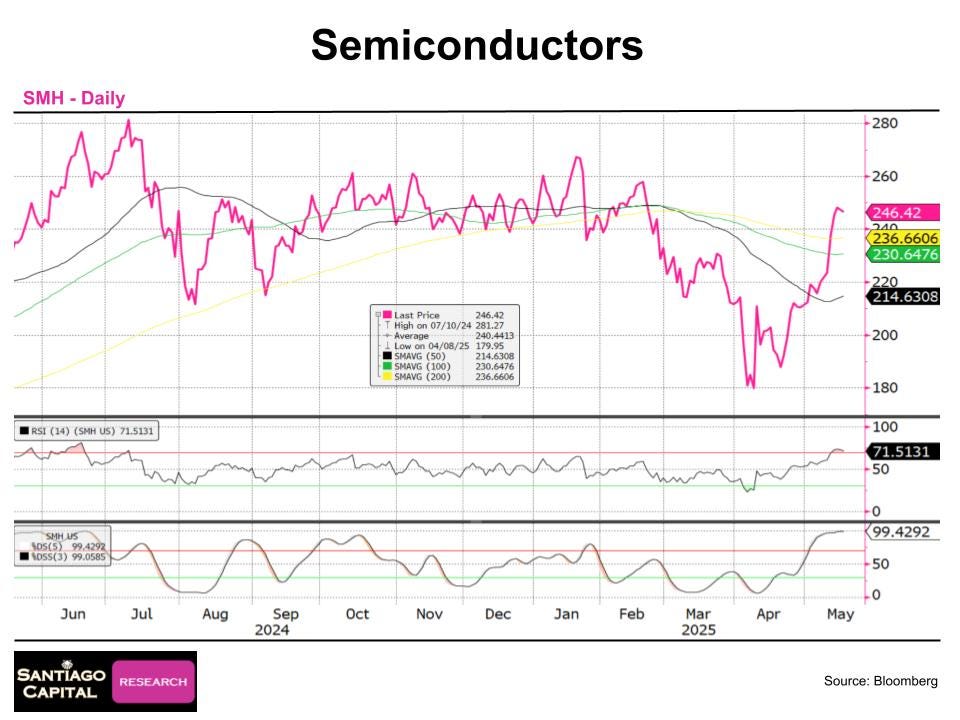
The semiconductor ETF (SMH) is overbought, with a steep rally reminiscent of last summer’s peak.
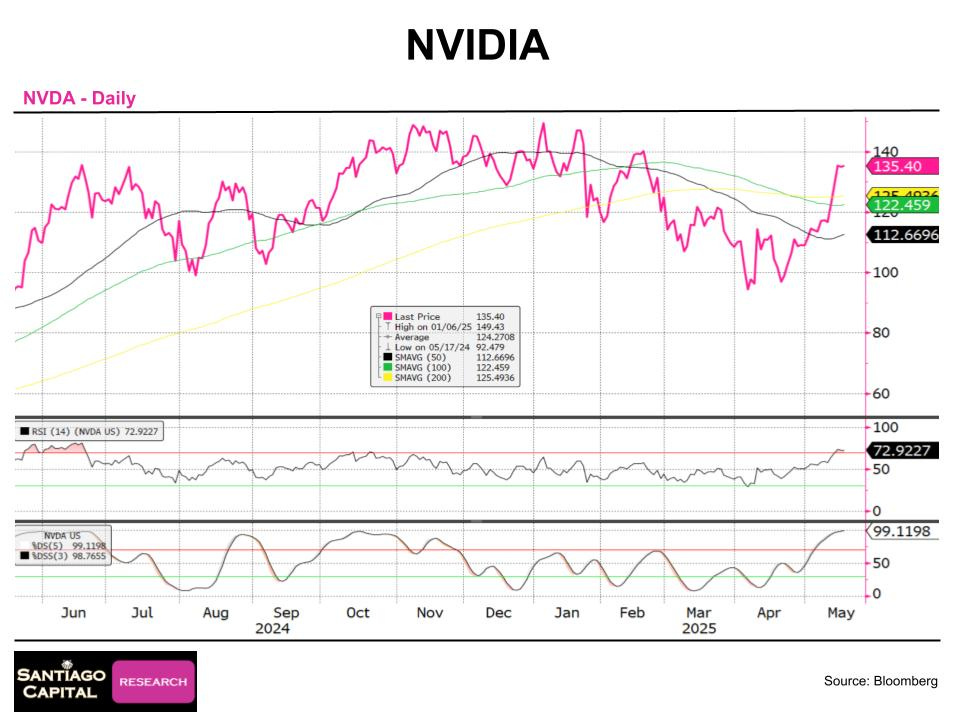
Nvidia’s chart shows RSI in overbought territory and stochastics at 99, signaling a potential pause.
Even non-tech names like Disney are caught up in the rally, with exponential gains pushing RSI and stochastics to extremes.
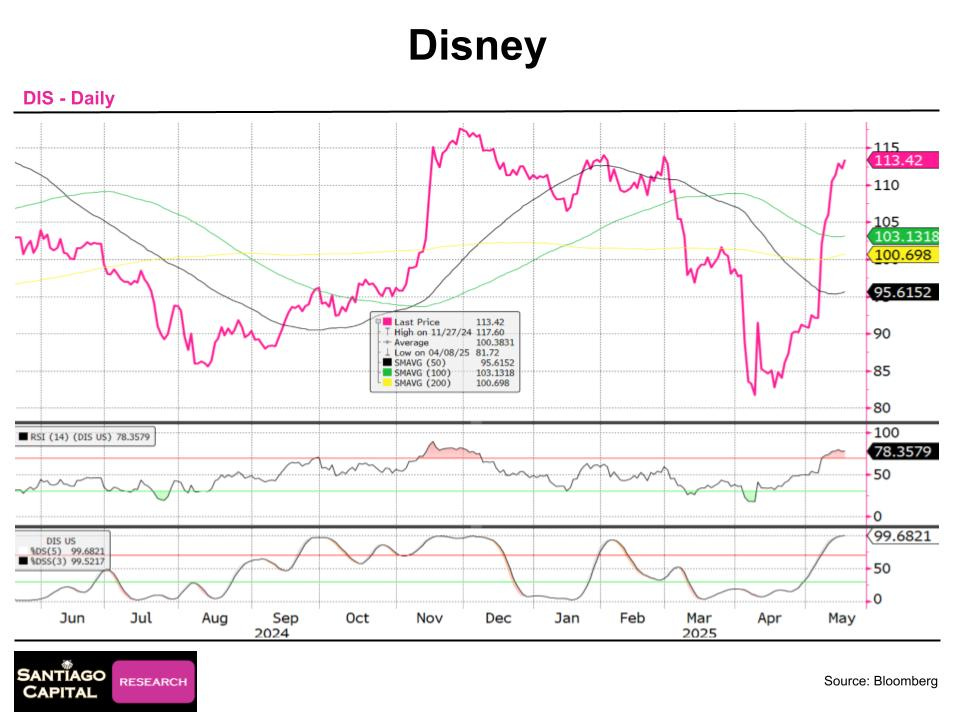
Disney’s chart shows a near-vertical rise, with RSI overbought and stochastics at 99.
Global markets are no exception.
Canada’s S&P TSX, Japan’s Nikkei, and Hong Kong’s Hang Seng have all surged, with technicals mirroring U.S. indices.
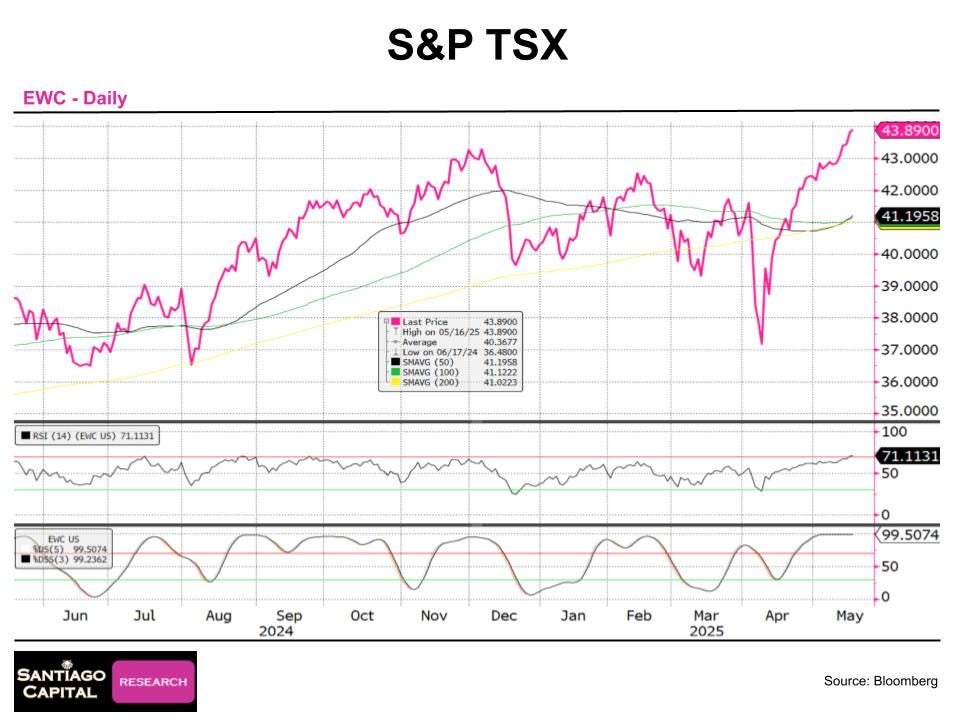
The S&P TSX ETF shows overbought RSI and high stochastics, with moving averages signaling caution.
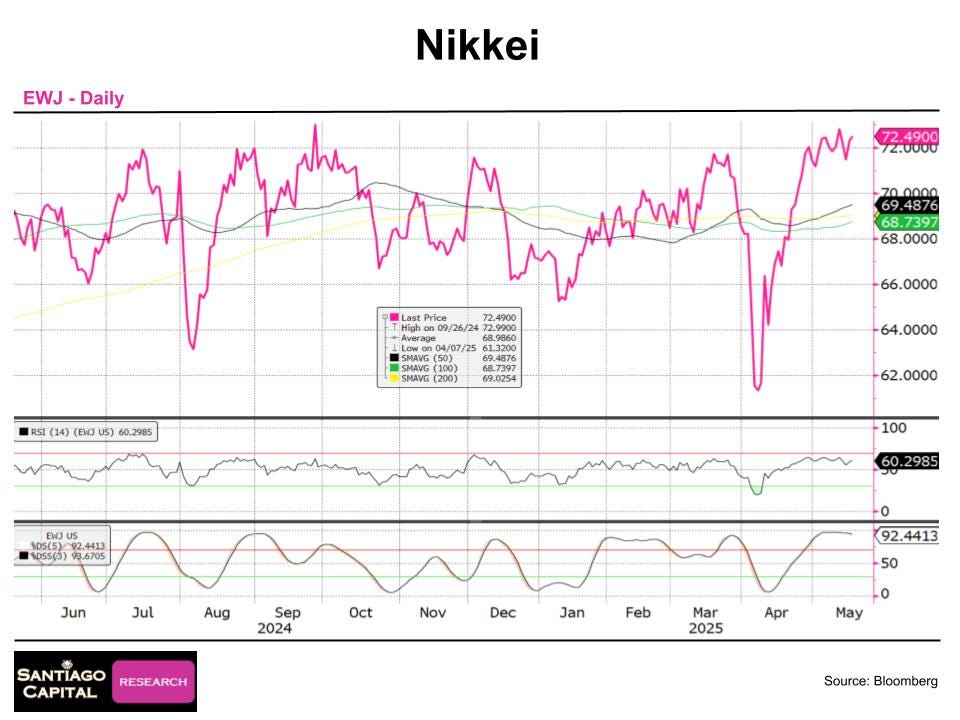
The Nikkei ETF, while less overbought, has high stochastics, suggesting a breather is due.
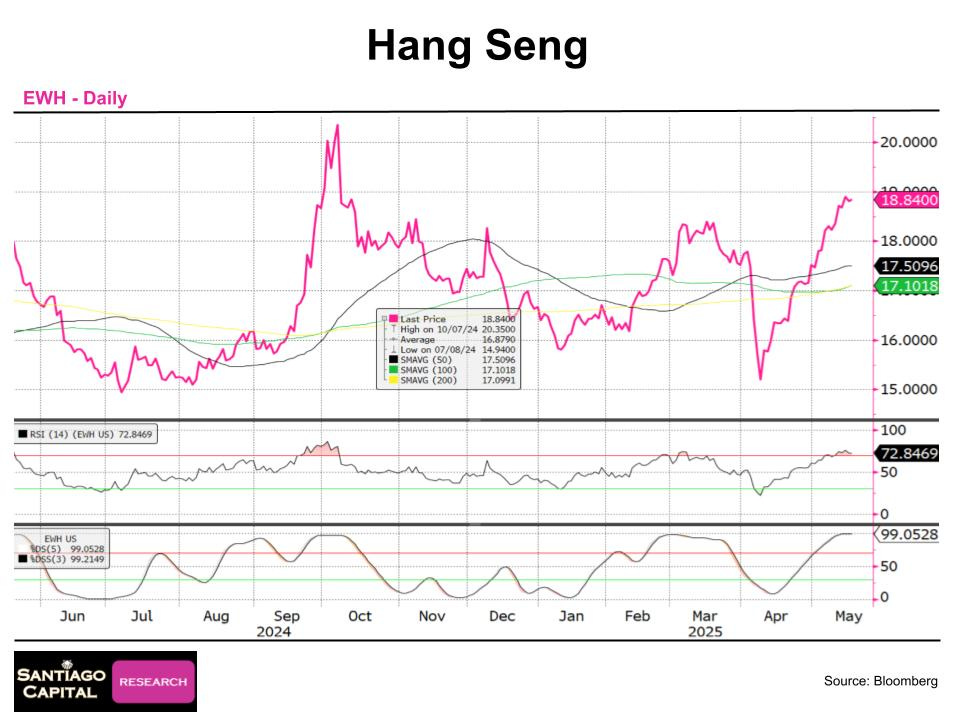
The Hang Seng ETF is overbought, with RSI above 70 and stochastics at 99.
When RSI hits 70 and stochastics scream 99, that’s not momentum…it’s mania. But the real danger isn’t just overbought charts. It’s the complacency behind them.
Because while prices levitate, hedging disappears. And when volatility returns, it doesn’t knock…it kicks the door in…
Sentiment and Volatility: Complacency Reigns
Market sentiment is another red flag.
The put/call ratio, which measures the volume of put options (bearish bets) versus call options (bullish bets), hit its lowest level in over a year last week, indicating minimal demand for downside protection.
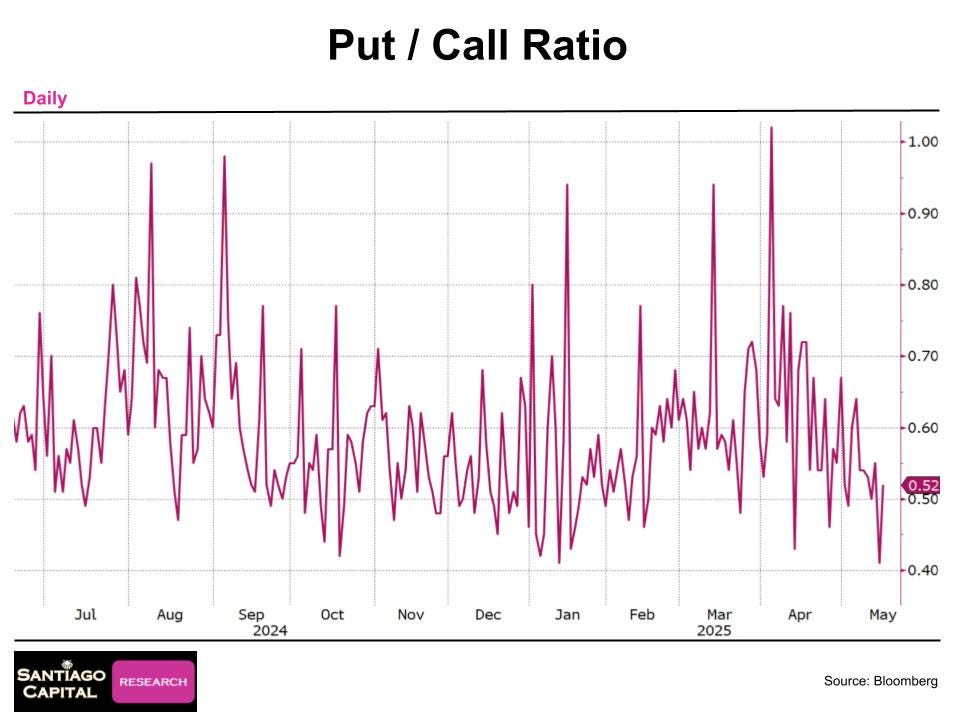
This chart shows the put/call ratio plummeting, reflecting widespread bullishness and a lack of hedging.
Sentiment indices for the S&P 500 and Nasdaq are at 79, just shy of the “concerning” threshold of 80, a stark contrast to the extreme fear a month ago.
The VIX, a measure of market volatility, has collapsed below 20, with stochastics near zero, signaling complacency.
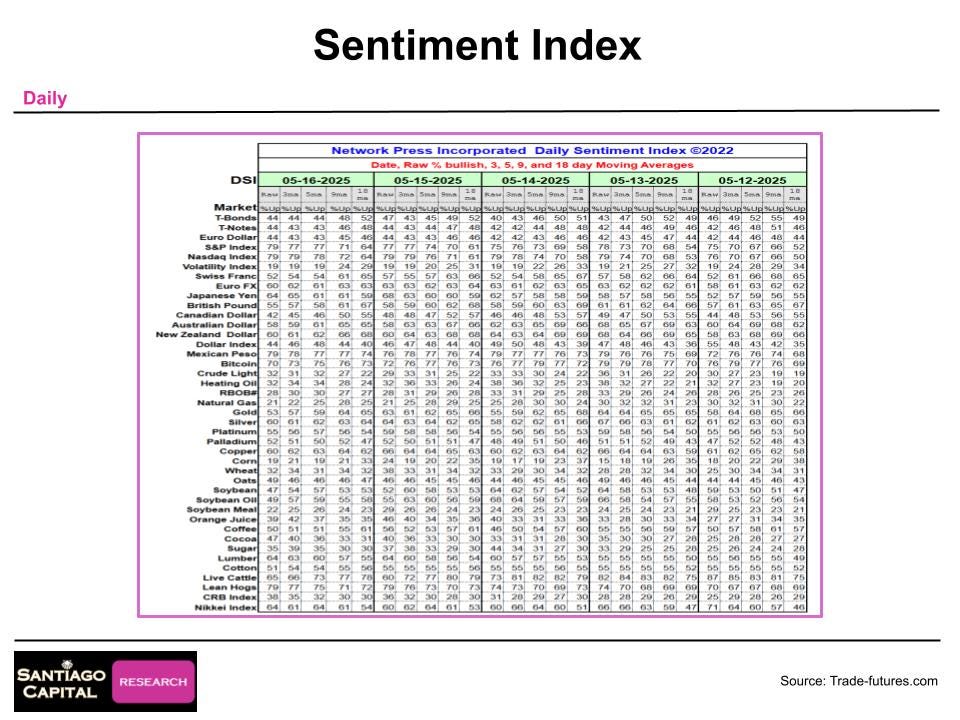
This slide highlights sentiment nearing concerning levels, with the VIX below 20, a sharp reversal from April’s panic.
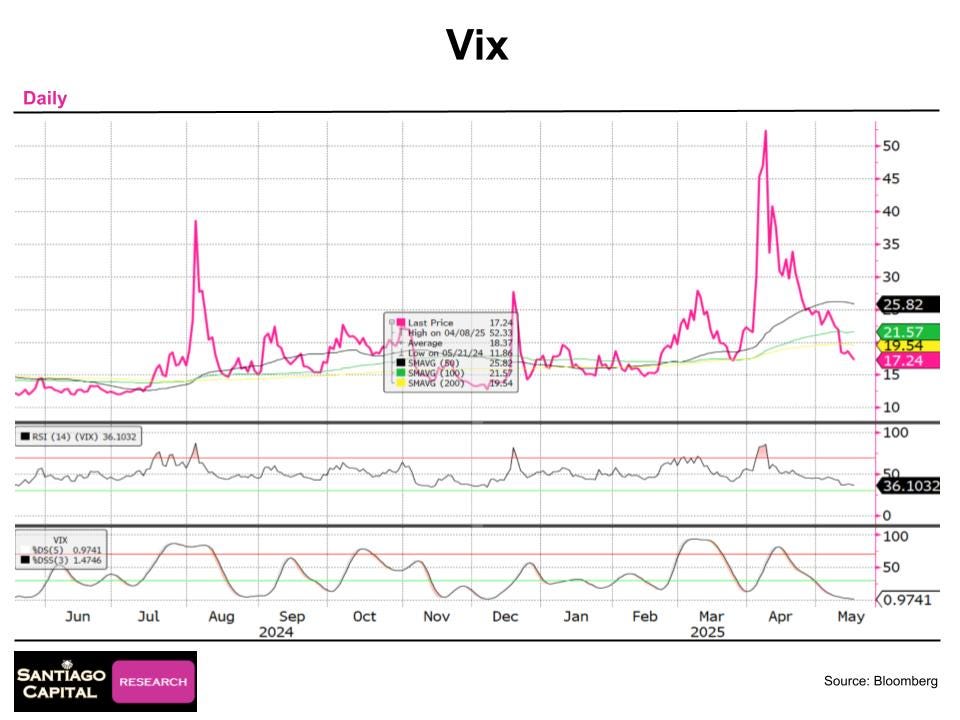
The VIX chart confirms low volatility, with stochastics at 1, suggesting markets are unprepared for shocks.
They say, “It’s different this time.” But the debt is bigger. The yields are higher. The geopolitical stage is hotter. And the market’s margin for error? Thinner than ever.
Which brings us to the one question that could define the rest of 2025…
Is This Time Different?
The refrain “it’s different this time” has echoed with every downgrade, yet markets have largely shrugged off past cuts.
In 2011 and 2023, the U.S. faced trade deficits, budget deficits, and geopolitical tensions, much like today.
While the scale of debt and deficits is larger now…over $35 trillion, and continuing to grow…the core dynamics remain.
The U.S. remains the world’s primary reserve currency issuer, and Treasuries are still a global safe haven.
However, risks are mounting. Rising U.S. yields could strain global funding markets, as many countries and institutions hold U.S. debt.
A Treasury sell-off would ripple worldwide, potentially amplifying volatility.
Geopolitical tensions, trade uncertainties, and domestic political gridlock add fuel to the fire.
The technical setup…overbought equities, complacent sentiment, and low volatility…suggests markets are vulnerable to a catalyst like Moody’s downgrade.
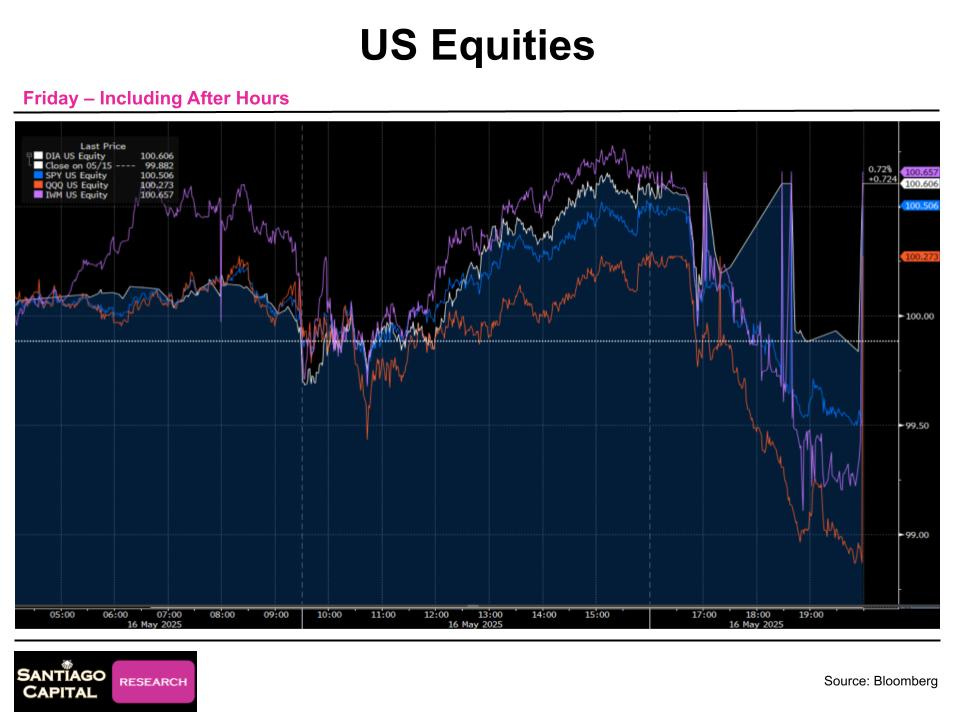
This chart captures Friday’s after-hours sell-off post-Moody’s announcement, hinting at potential volatility when markets reopen.
Navigating the Storm
So, what does this mean for investors? The historical record suggests caution but not panic.
Previous downgrades didn’t trigger collapses, but they did spark volatility, particularly in equities.
Current technicals scream for a breather, with overbought conditions across assets.
The put/call ratio and VIX indicate now is a cheap time to buy protection, unlike a month ago when hedges were costly.
The Milkshake Theory framework remains relevant: rising rates could weaken bonds but strengthen the dollar, which could then translate into a global funding squeeze.
Because global markets are interconnected, and a U.S.-centric shock could reverberate. Investors should monitor yields, the dollar, and equity technicals closely.
Hedging strategies, selective shorts, or reduced exposure to overbought sectors like tech may be prudent.
Monday’s open will be telling. Will markets brush off the downgrade as they did in 2011 and 2023, or will this be the spark that ignites a broader correction?
Only time will tell, but history and current signals urge vigilance. The macro environment is a thrilling, high-stakes game…enjoy the ride, but play it smart.
🔴 Money isn't Everything...But the lack of it is...Here's the uncomfortable truth facing European Institutions...

