


The U.S. dollar faced another challenging week, prompting widespread discussions about its trajectory and broader implications for global financial markets.
The dollar’s recent decline, down approximately 8-10% year-to-date, has reignited debates about its stability, with some (again) predicting its imminent collapse.
However, a closer examination of market sentiment, technical indicators, and the broader economic framework reveals a more nuanced picture.
Is the move lower largely done? Or is there more to come?
The Dollar’s Decline: Sentiment at Extremes
The dollar’s recent weakness has been driven by softer-than-expected economic data, notably lower Consumer Price Index (CPI) and Producer Price Index (PPI) readings.
These figures fueled speculation that the Federal Reserve would be more likely to consider further interest rate cuts, reducing the dollar’s yield appeal.
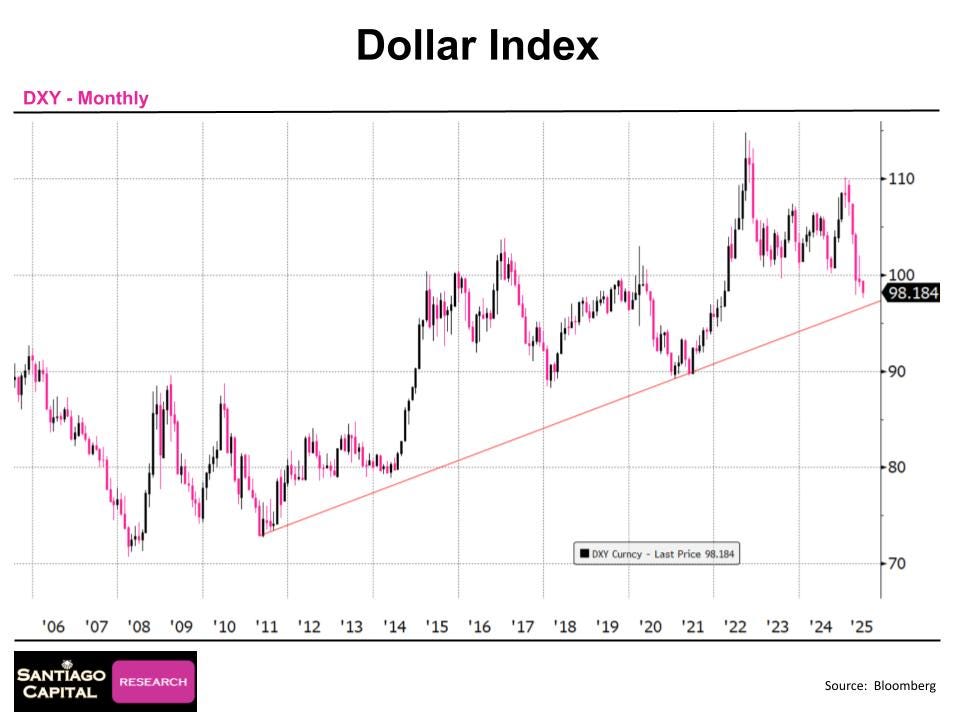
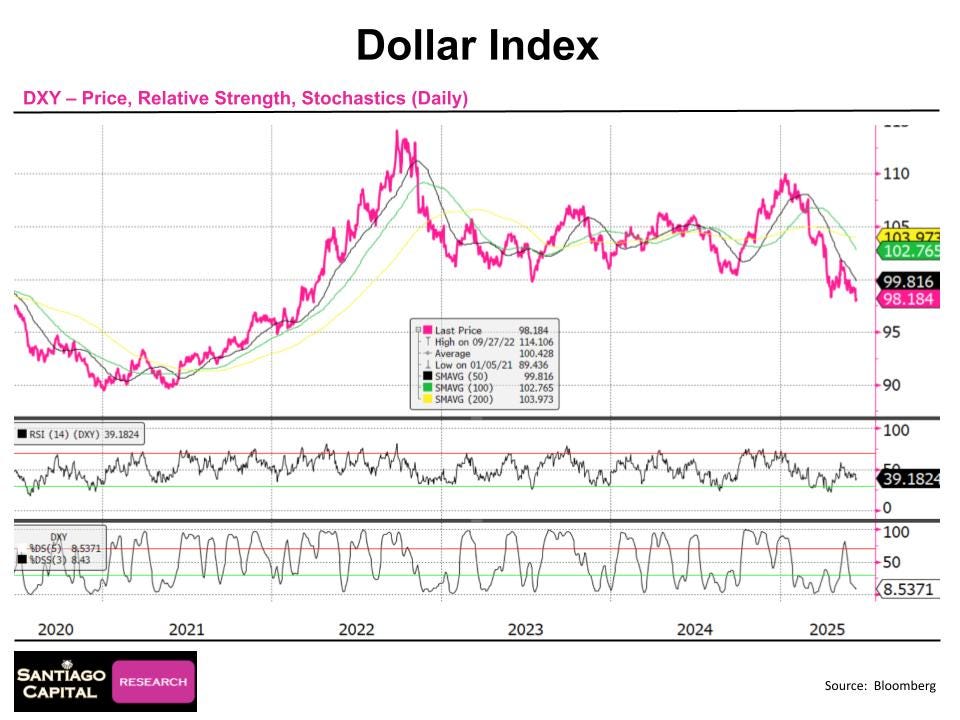
As a result, the U.S. Dollar Index (DXY), which measures the dollar against a basket of six major currencies, fell to 98, close to its year-to-date lows.
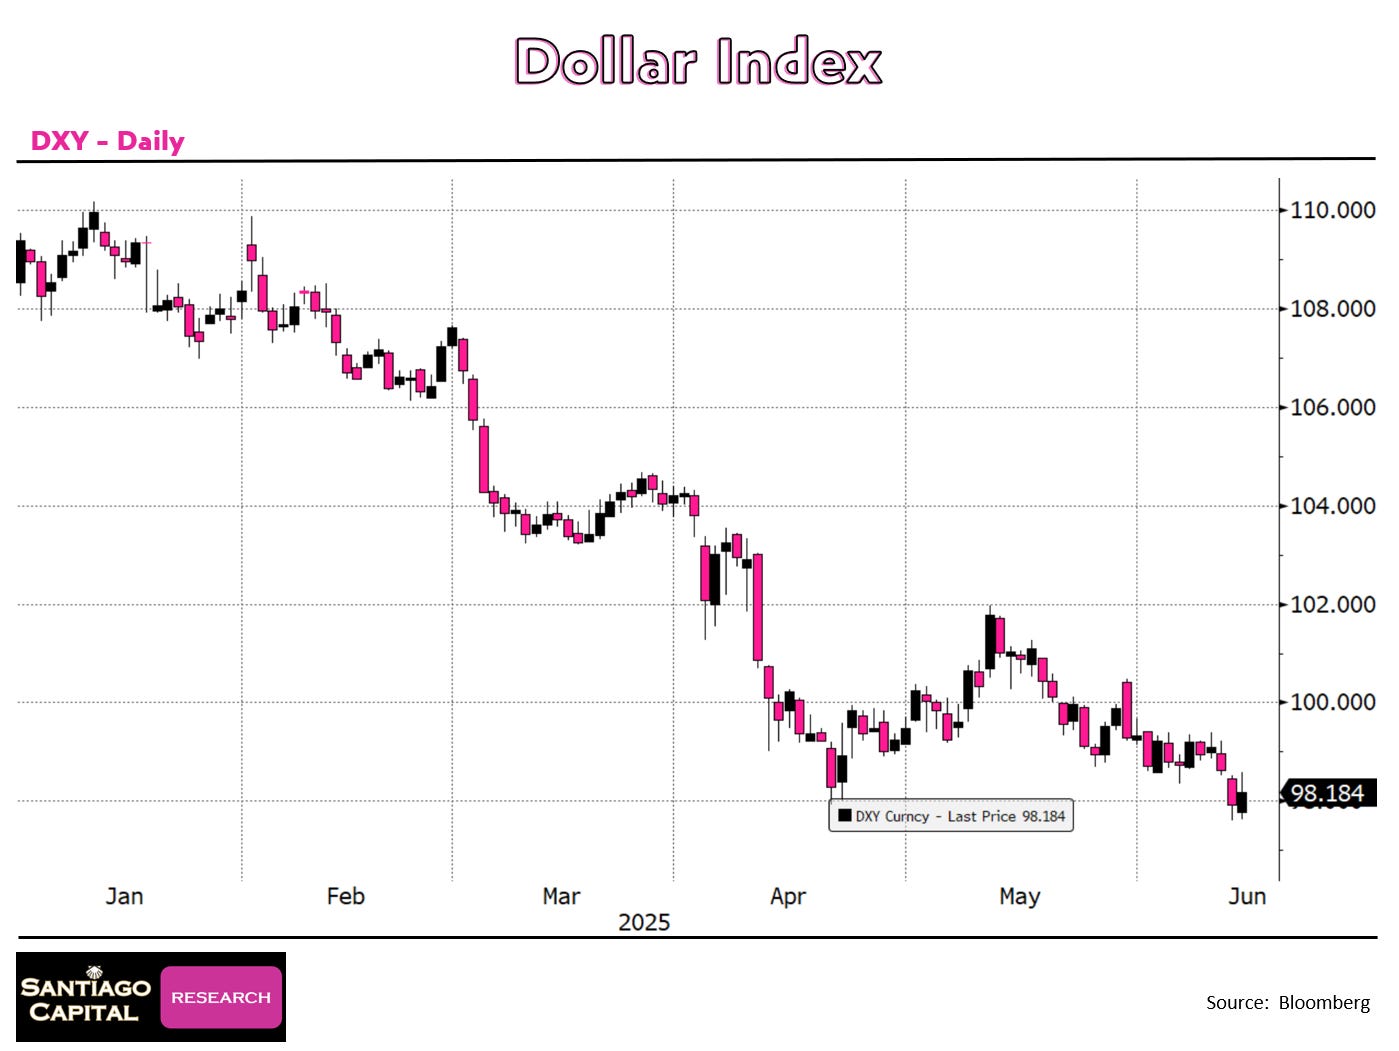
This decline triggered a wave of bearish sentiment, with many market participants declaring the dollar’s demise.
Sentiment indicators provide critical insight into this narrative.
One widely used sentiment gauge ranks assets on a scale from 0 to 100, with readings above 80 or below 20 signaling extreme market conditions.
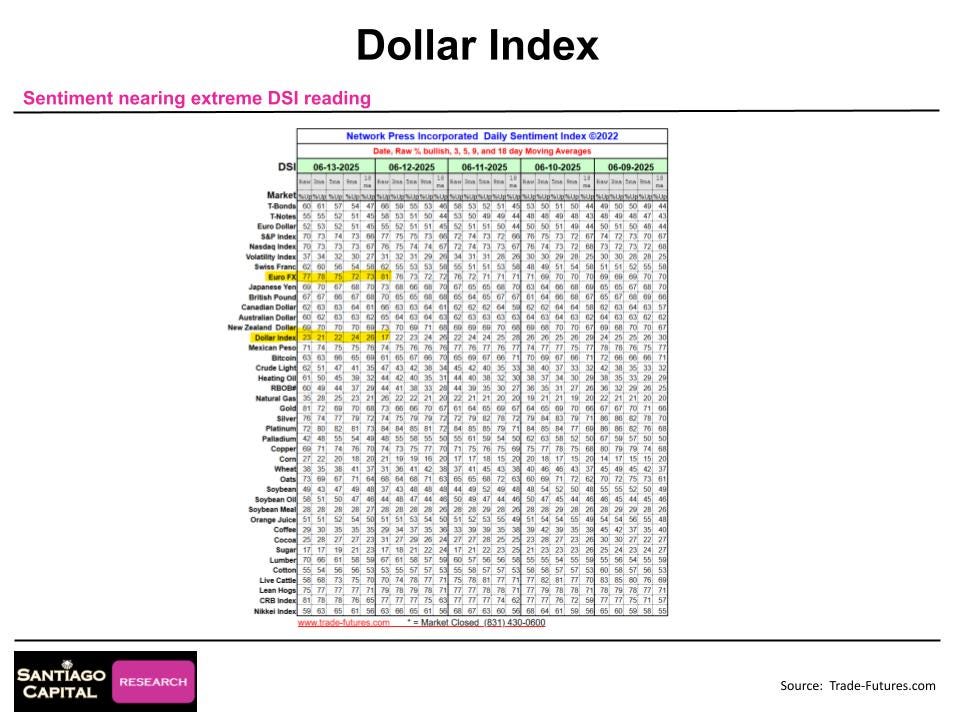
On Thursday, June 12, the DXY’s sentiment score dropped to 17, recovering slightly to 23 by Friday’s close.
While not quite in single-digit territory, this level is near the extreme low, suggesting the dollar is approaching an inflection point.
Bank of America’s Bull-Bear Index showed similar results with sentiment at an all time low with positioning also nearing its historical extreme.
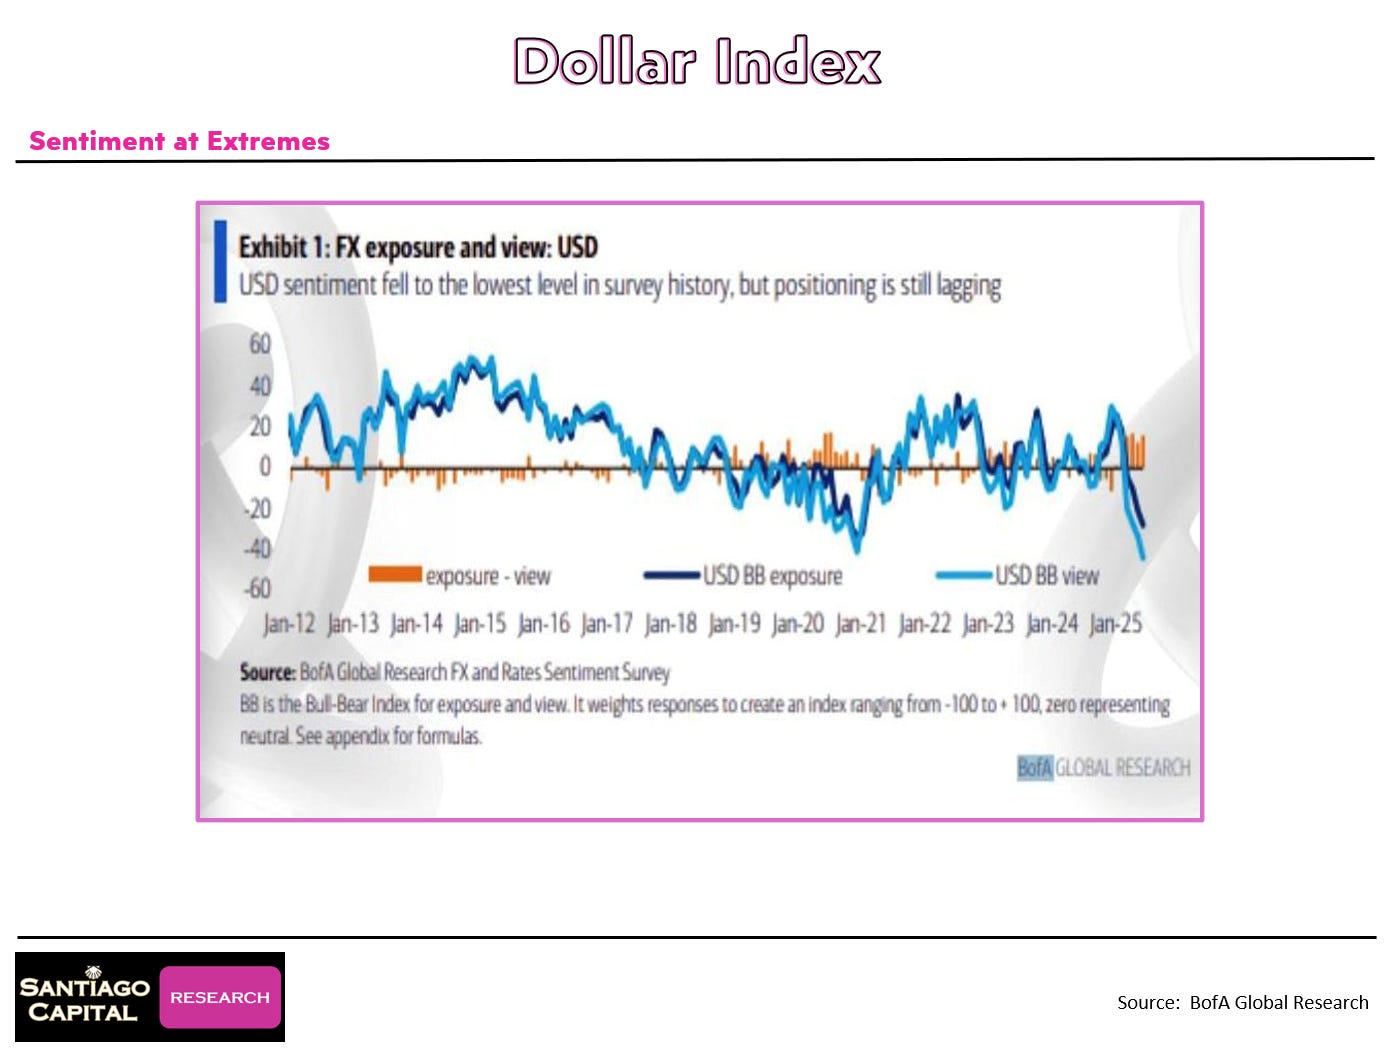
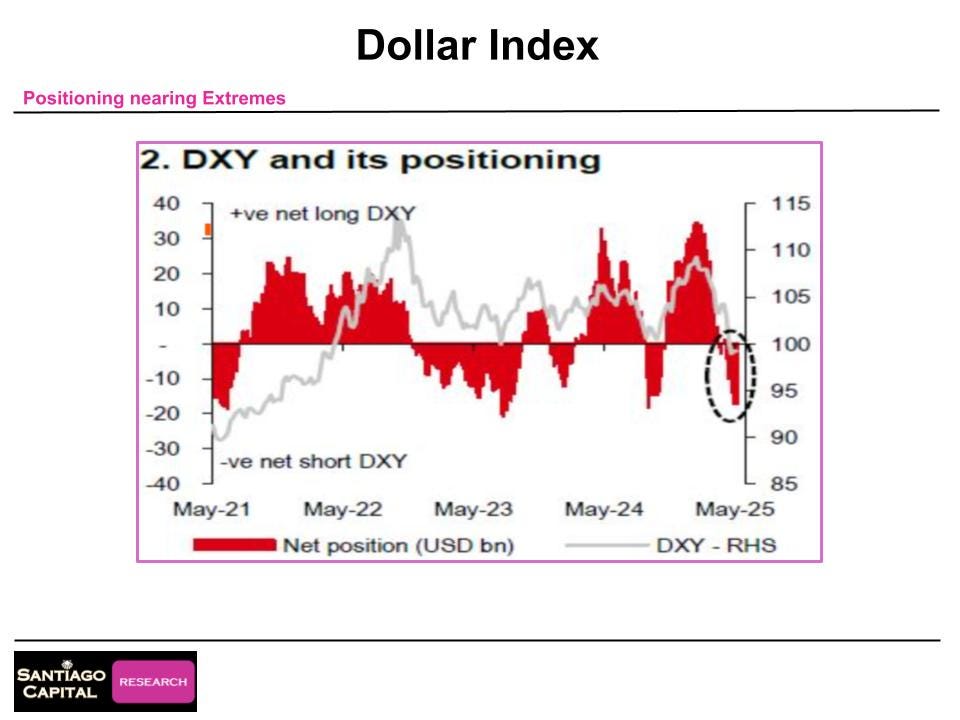
Historically, such readings have often preceded reversals, though no guarantees exist.
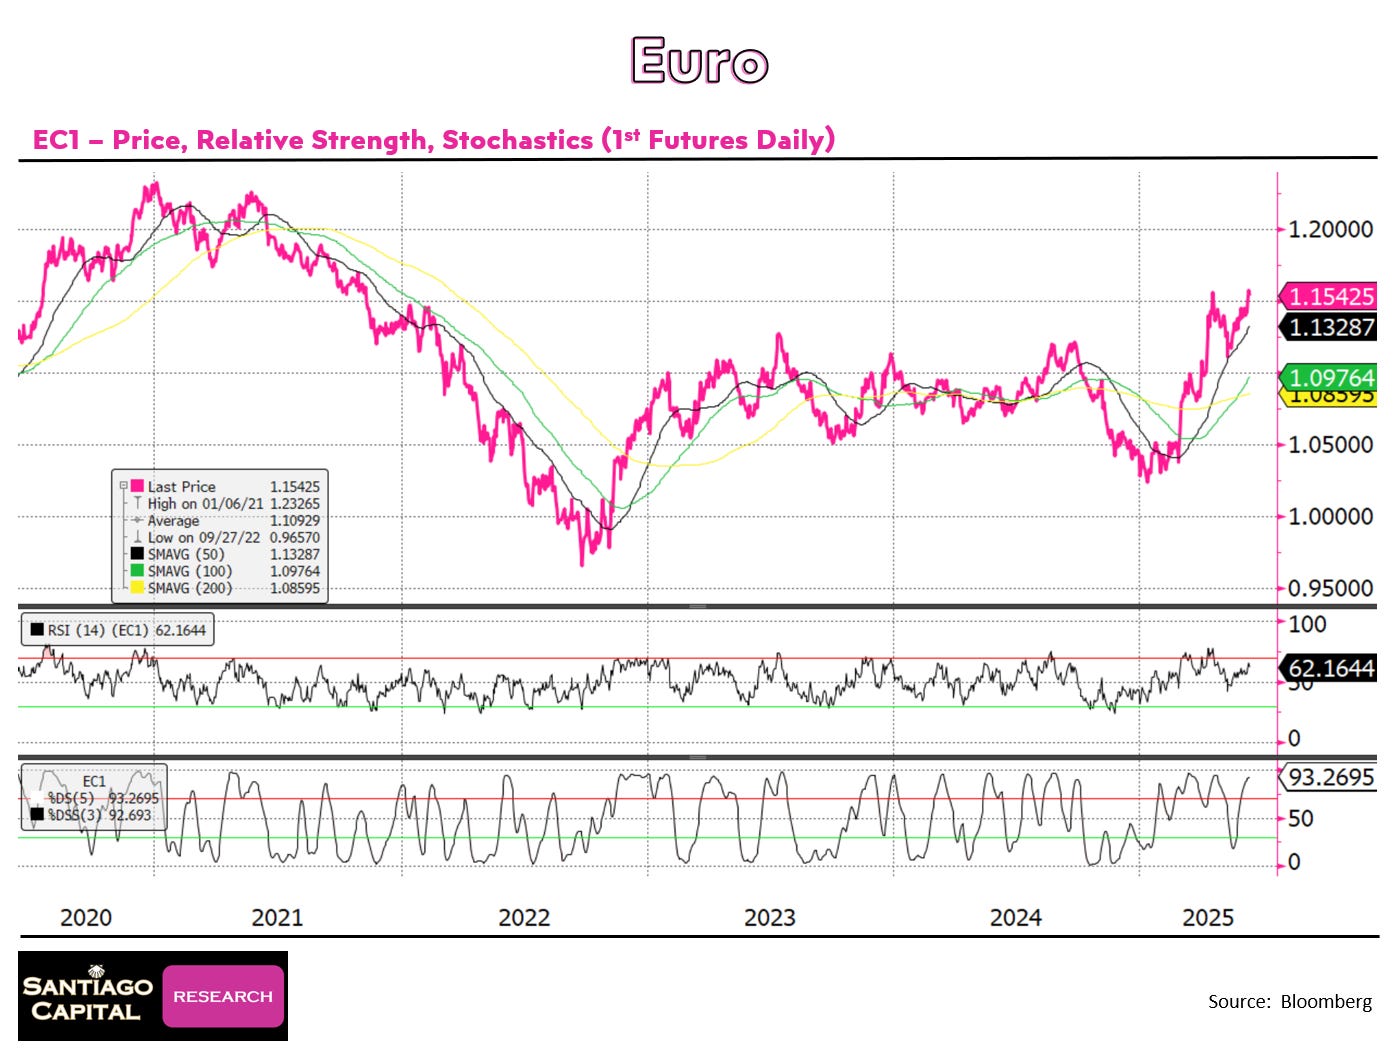
Conversely, the euro, a major component of the DXY, saw its sentiment soar to 81 on Thursday, peaking intraday around 85-86 before easing to 77 by Friday (see chart above).
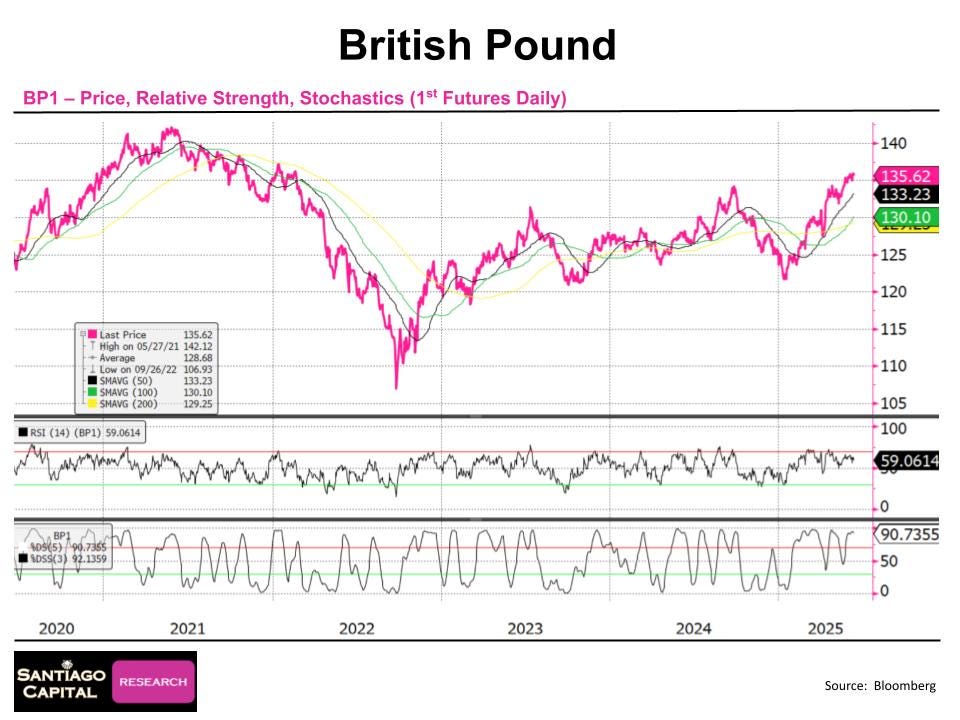
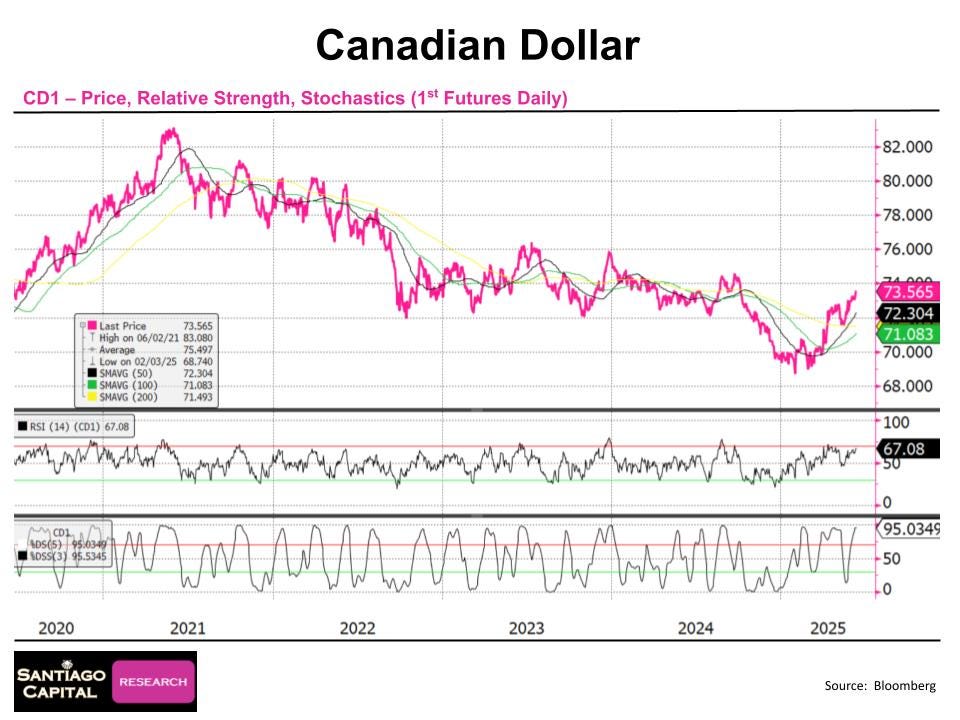
Other currencies, like the British pound and Canadian dollar, registered elevated sentiment in the 60s and 70s, but none matched the euro’s intensity.

The Milkshake Theory: A Framework for Context
To understand the dollar’s movements over longer time periods, we find it useful to consider the dollar milkshake theory, a framework for analyzing market dynamics during a sovereign debt crisis.
Six years ago, this framework predicted that in the years ahead, rising U.S. interest rates would attract global capital, strengthening the dollar while boosting U.S. equities and gold prices.
Although a full-blown sovereign debt crisis has not yet materialized, the framework has proven effective in explaining market behavior over the past five to six years.
Since 2018, the bond bull market has waned, with interest rates rising and bond prices, including U.S. Treasuries, falling.
Over this period, the DXY has risen while U.S. equities and gold have also appreciated, aligning with the theory’s predictions.
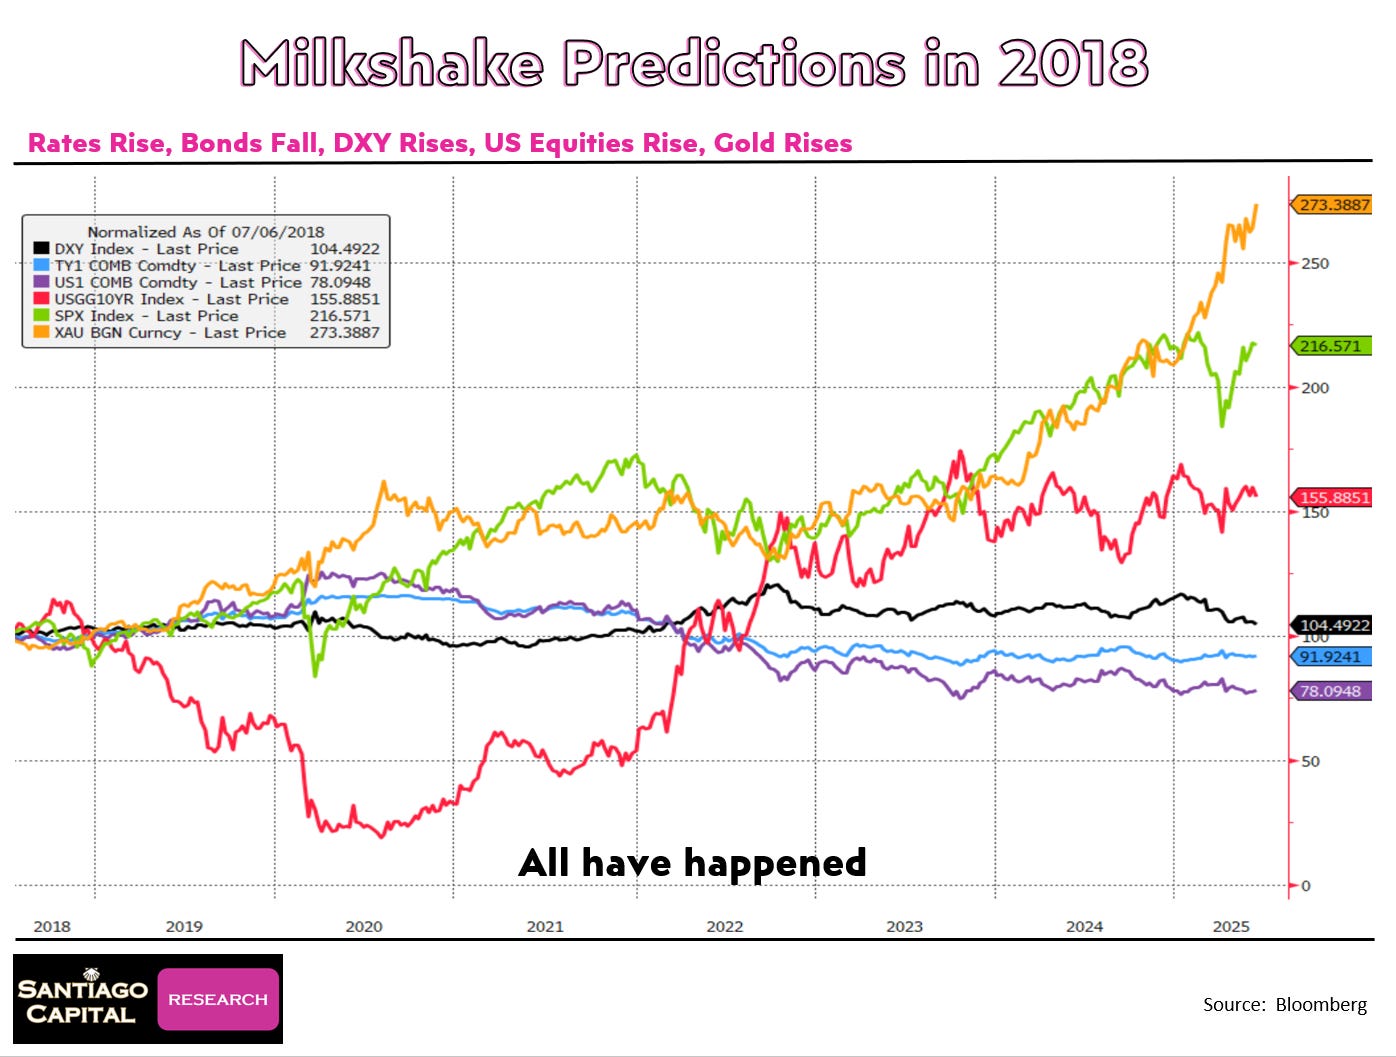
While the dollar’s ascent hasn’t been linear, its resilience amid persistent calls for its collapse underscores its enduring strength as a result of their just being no other good option to replace it.
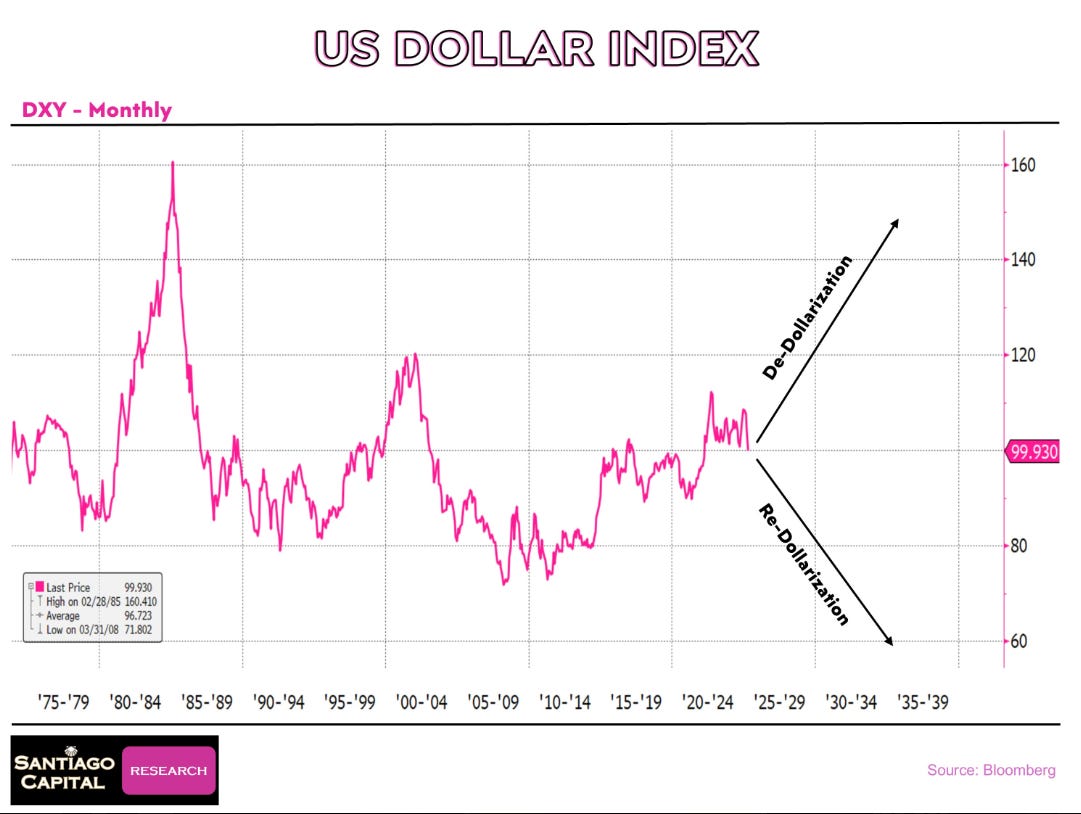
If the dollar were to fall further, say to the mid- or low-90s, the theory suggests this would just kick the eventual sovereign crisis down the road, as a falling DXY is predicated on increased dollar liquidity being available.
But increased dollar liquidity comes as a result of new USD credit being extended. And new USD credit just creates new future USD demand to service and extinguish that newly created credit.
In other words, a falling DXY is “re-dollarization”, not “de-dollarization”. Only a rising DXY causes the forced liquidation of USD debt. In other words, true de-dollarization comes as a result of a rising DXY, not a falling DXY.
But why might the dollar defy expectations and surge rather than fall further from here?
Technical Support Levels: A Floor for the Dollar?
Technical analysis offers additional clues about the dollar’s near-term path.
On a yearly chart spanning 15 years, the DXY finds support around 96, roughly 2% below its current level of 98.
Quarterly, monthly, and weekly charts reinforce this, identifying strong support in the 96-97 range.
Daily charts similarly point to a floor at 97-96.
While the dollar could breach these levels, the proximity of support across multiple timeframes, combined with extreme negative sentiment and positioning, suggests we may be close to a bounce.
Relative Strength Index (RSI) and stochastic indicators further illuminate the dollar’s position. Over a five-year period, the DXY’s RSI stands at 35, low but not extreme.
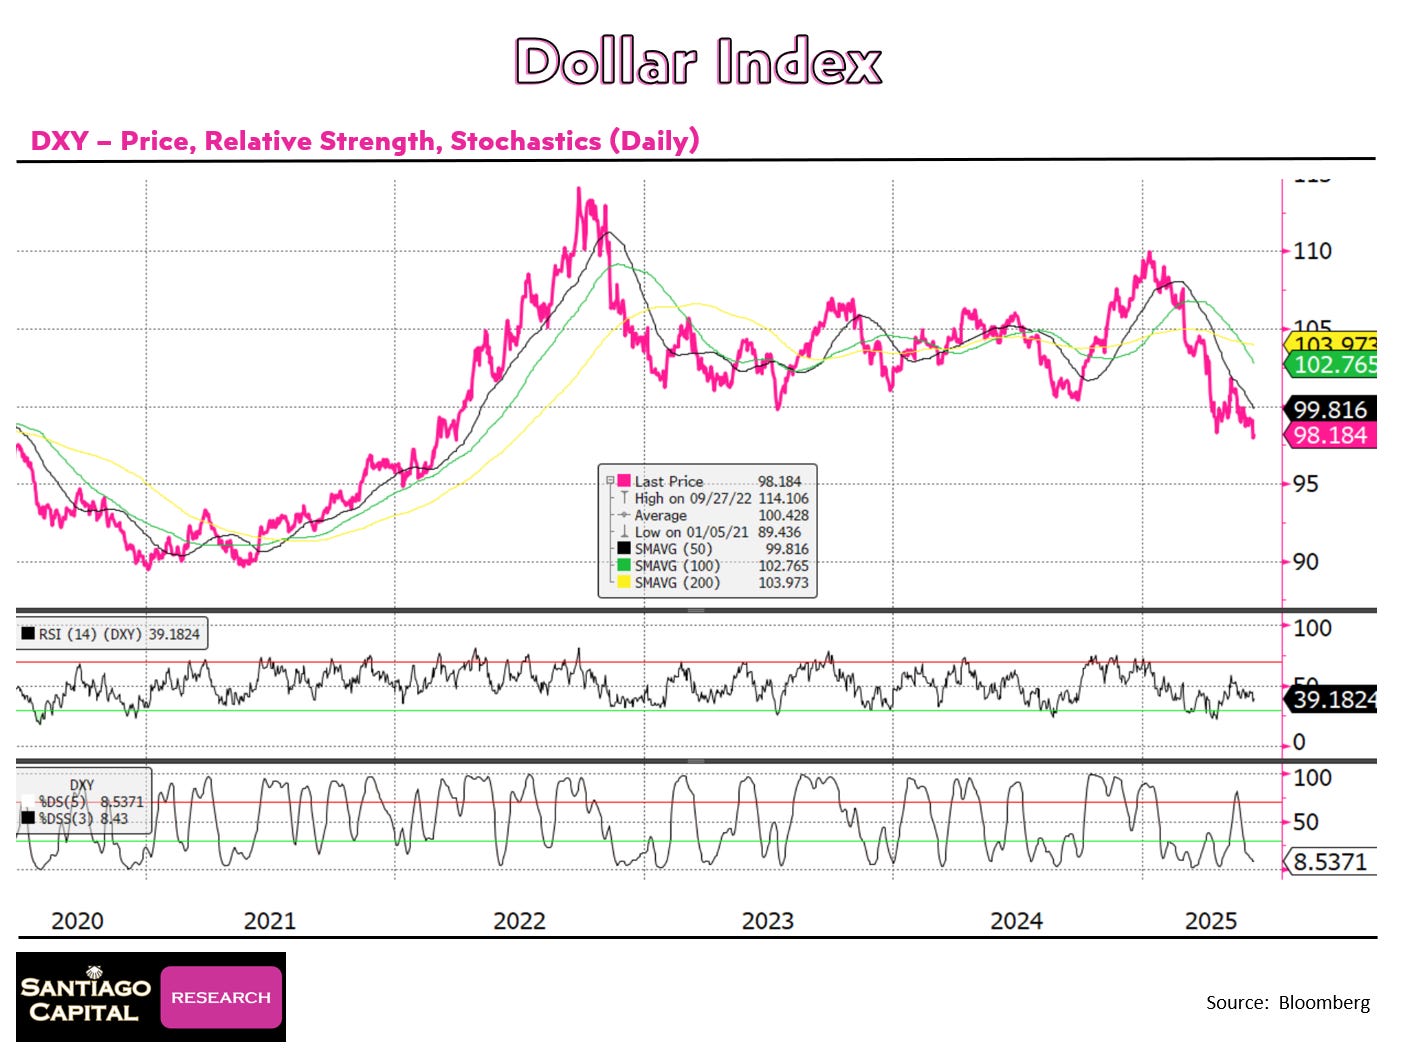
However, its stochastics are in single digits, indicating extreme oversold conditions in the short term.
In contrast, the euro’s RSI and stochastics are elevated, nearing overbought territory, while the Canadian dollar shows similar overbought signals.
The yen, pound, Swiss franc, and Swedish krona are less extreme, offering limited directional cues.
These imbalances suggest the dollar’s decline may be nearing exhaustion, but will technical support hold, or is a deeper correction looming?
Liquidity and Debt: The Dollar’s Dual Role
The dollar’s direction has profound implications for global liquidity.
A falling dollar typically signals abundant dollar liquidity, as new debt creation…loaned into existence…floods markets.
This “redollarization” process, increases liquidity and supports asset prices but creates future dollar demand to service that debt. (see chart above)
Conversely, a rising dollar tightens liquidity, triggering deleveraging and potential market chaos, a scenario associated with dedollarization and a possible transition to a new financial system. (see chart above)
If the DXY continues to slide into the 90s or even 80s, it would delay this reckoning, providing markets with additional liquidity.
However, the eventual dollar spike could be more severe, as accumulated debt amplifies future demand.
This dynamic underscores the milkshake theory’s core insight: a weaker dollar today sows the seeds for a stronger dollar tomorrow.
How long can markets sustain this liquidity-driven rally before facing a dollar-driven correction?
Asset Prices and Market Extremes
The dollar’s decline has coincided with robust asset price performance, but signs of overheating are emerging.
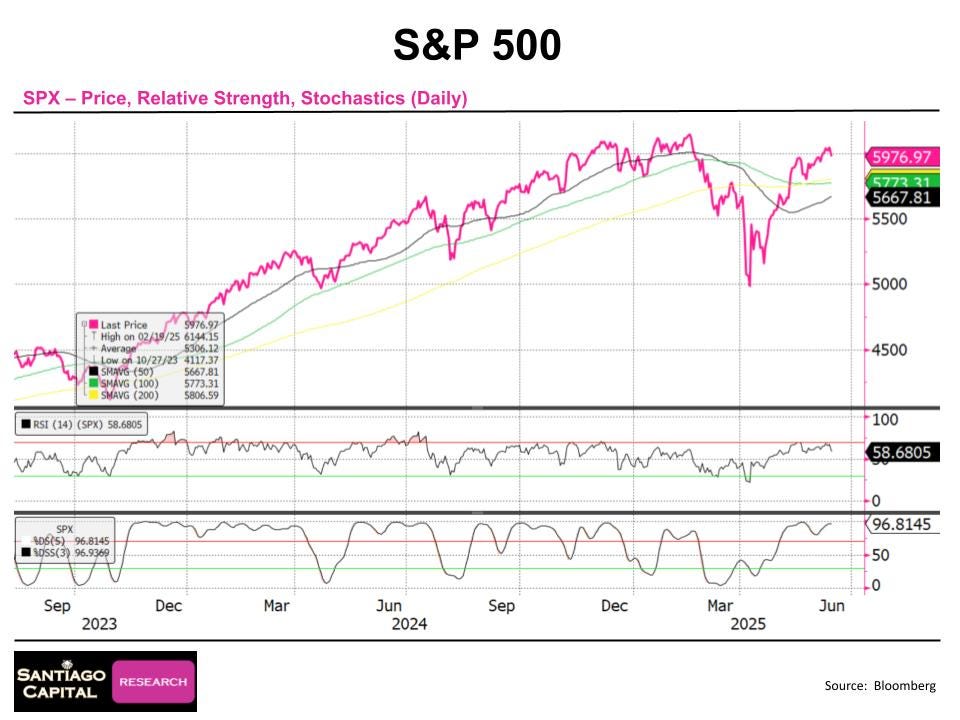
The S&P 500, has oscillated between extremes over the past year.
Last summer, it was overbought, followed by a sharp sell-off. Early 2025 saw another rally, but a subsequent decline pushed it toward oversold territory.
By mid-June, markets have rebounded, stochastics were near their highs, signaling overbought conditions again.
Semiconductors and stocks like Microsoft exhibit similar patterns, with RSI and stochastics at or near peak levels, suggesting a potential pullback.
The VIX, a measure of market volatility, remains subdued despite recent geopolitical tensions, with stochastics recently at 2-3 before a modest bounce to 20.
Gold and silver, buoyed by Middle East unrest, posted sentiment readings of 81 and 76, respectively, but their price gains were modest.
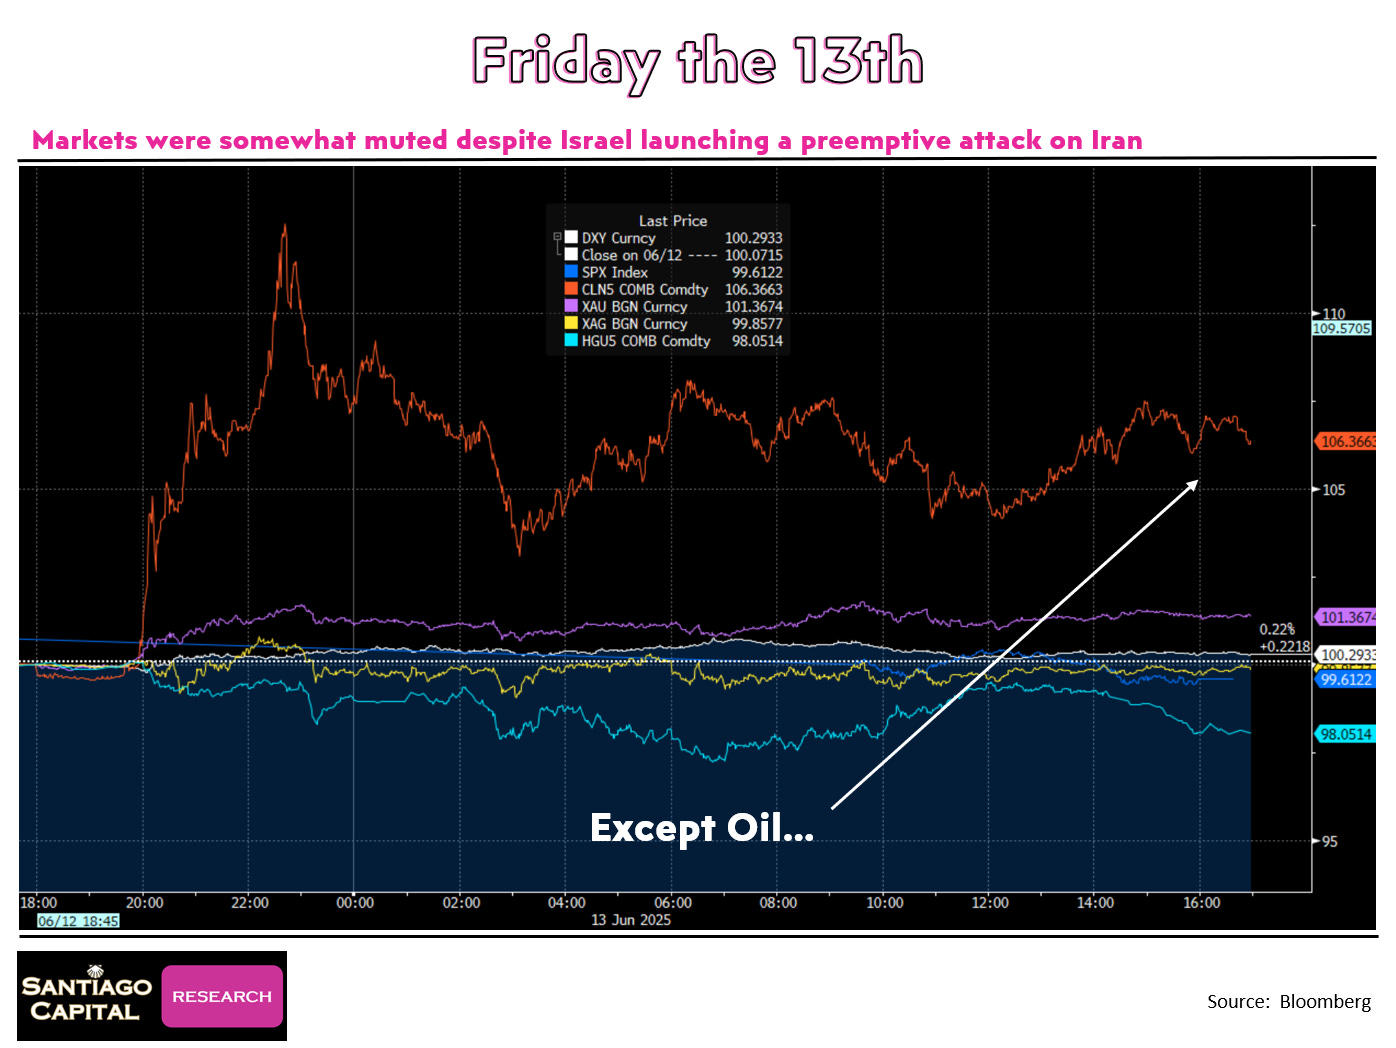
Oil, however, surged 7-9%, reflecting heightened geopolitical risks.
These mixed signals raise a critical question: are markets poised for a correction, or can they defy gravity for another month?
Geopolitical Risks and Market Mutedness
Friday, June 13, 2025, was an unusual day for markets.
Despite Israel’s military actions against Iran, traditional safe-haven assets like Treasuries and the dollar saw muted demand.
Gold rose $30, but less than expected given the geopolitical backdrop.
Equities sold off moderately, and the VIX’s jump to 20 was notable but not extreme.
Oil’s sharp rise stood out, but overall market reactions were surprisingly restrained.
This muted response, combined with delayed tariff implementations, may have lulled investors into complacency, underestimating potential volatility.
Could the Middle East conflict ignite a broader market reaction, and how would the dollar respond?
Inflection Point on the Horizon?
While the dollar’s immediate path remains uncertain, several indicators suggest an inflection point is near.
Extreme sentiment, oversold technicals, and robust support levels at 96-97 bolster the case for a potential rebound.
However, a further decline to test these supports is plausible, especially if liquidity remains abundant.
Asset prices, meanwhile, are at or near overbought extremes, hinting at a possible correction.
Geopolitical risks, particularly in the Middle East, add a layer of uncertainty, with the potential to disrupt markets swiftly.
Whether this marks a dollar rally, an asset price correction, or both, remains to be seen.
Navigating Uncertainty with Clarity
The U.S. dollar’s recent decline has sparked intense debate, but a fact-based analysis reveals a complex interplay of sentiment, technicals, and macroeconomic forces.
The milkshake theory provides a valuable lens, highlighting the dollar’s role in a liquidity-driven market and its potential to surge in a crisis.
With sentiment at extremes, technical support nearby, and asset prices stretched, markets are at a crossroads.
Geopolitical risks further complicate the outlook, and investors must stay vigilant, balancing the opportunities of a weaker dollar with the risks of a sudden reversal.
As markets navigate this uncertainty, one question lingers: will the dollar’s next move be higher or lower?
One thing that should investors should consider, is the extreme negative sentiment, readings, and positioning…all with the DXY still at 98.
The dollar moving higher from here would catch many market participants flat footed…
There is a free version, paid version, and Pro version of Santiago Capital here on substack. All three contain lots of words, and charts…though perhaps some of the better words are in the two paid versions. Capitalism always finds a way, doesn’t it?
We’d be appreciative if you signed up and doubly appreciative if you invested in a paid subscription for yourself (mid tier) or your firm (pro level) and helped us keep these insights flowing.
