


“You can’t always predict the next move, but you can prepare for when the crowd leans too far and forgets gravity still exists.” — Brent Johnson

It was late August 2024. Somewhere between Hugh Hendry’s beach camp in St. Barts and the daily churn of macro madness, I recorded a podcast.
What came out wasn’t just market commentary. It was an x-ray.
Not of the market…but of my process.
Call it “The Anatomy of a Trade.”
This wasn’t some vague Dollar Milkshake metaphor…though that theory anchored my view.
No, this was me peeling back the layers…showing how I waited patiently, read the signals, and then struck when the opportunity presented itself. And how I the managed the risk when it did go my way
If you want to trade like this, you need discipline & patience. But more importantly you need a process. A repeatable process. And you have to be comfortable with looking wrong just before being right.
Let’s break it down.
Step 1: The Macro Map (Start With the Milkshake)
Before I look at charts, I starts with the world I’m currently operating in.
For me, the framework used to view this world is the Dollar Milkshake Theory.
Here is the short version at the time of the recording:
The U.S. dollar was still at the top of the global financial food chain.
Most global debt was dollar-denominated.
When stress hits, capital rushes into dollars…not out.
That creates dollar strength, punches risk assets, and wrecks dollar borrowers abroad as liquidity exits their local markets.
But remember, this is a roadmap, its not a crystal ball and its not a perfecting timing tool.
So, my first move is always to ask:
“Where are we in the global liquidity cycle?”
Is the Fed easing or tightening? What are the other global Central Banks doing? Do markets have a tailwind or are they fighting a headwind?
Step 2: Volatility is the Siren (Listen for Screams)
I start every morning but checking Gold and the VIX…the “fear gauges.” But not just the level. The rate of change matters just as much.
Go back to August 5, 2024:
VIX spiked to 65.
Equities tanked.
Gold fell $100.
Oil dropped over 5%.
But just days later? The VIX collapsed back below 20. Equities, Gold, and Oil all rallied.
It wasn’t a crisis. It was a tantrum.
“Most people panic on the spike. I check to see if it’s real,” I explained.
If volatility rises but other stress signals don’t confirm (more on that next), it’s often a fake-out.
In August, I used this dislocation to cover the majority of our short positions. The crowd screamed the long awaited downturn was finally here. I faded it.
But why…?
Step 3: Credit Spreads – The Market’s Pulse
Next, I checked credit spreads—the difference between corporate and Treasury bond yields. This is a “second derivative” of volatility.
Why?
Because credit spreads tell you if the financial system is breaking.
In real crises (think 2008, 2020), credit markets seized. Liquidity dried up.
In August 2024?
“Spreads stayed tight—even as the VIX exploded. That’s not systemic. That’s a stress hiccup.”
When volatility spikes without credit confirming, it’s my first clue: this is’t the Big One.
Time to fade fear.
Step 4: Sentiment, Relative Strength, and Positioning – What’s the Crowd Thinking?
I also use a number of signals to help me gauge whether or not markets at at extremes.
Because this is when markets are most ripe for a reversal.
The signals I use are very simple. But when they flash red or green, they are very powerful. Especially when they all flash at the same time.
First I use the Daily Sentiment Index (DSI)—a simple but powerful tool that tracks how bullish or bearish markets are, on a 0–100 scale.
My rules of thumb:
Above 80: Overbought territory - get interested
Below 20: Oversold territory - get interested
Above 90: Time to act - no excuses
Below 10: Time to act - no excuses
“When a market gets to 85+ and everyone’s bullish—it’s usually time to sell or at least consider hedging,” I noted.
But sentiment alone doesn’t trigger trades. But if the crowd is euphoric, I get skeptical. If they are panicking, I get interested.
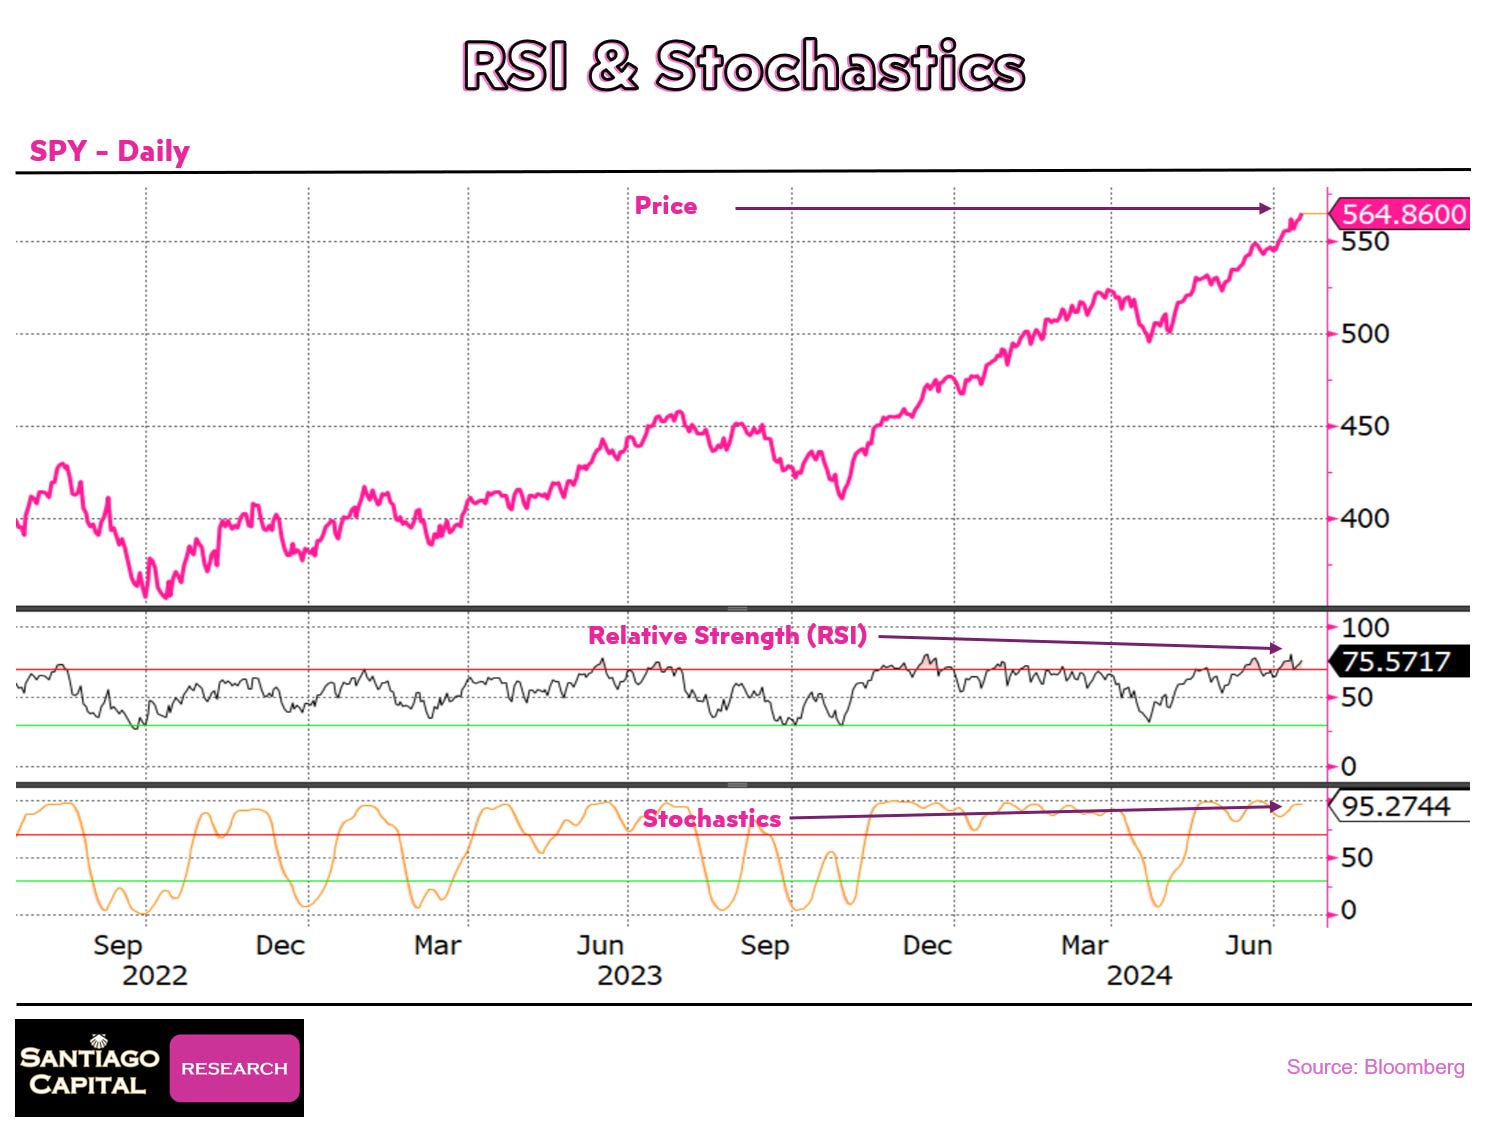
Second, I use Relative Strength. This is a simple way to gauge momentum. And when this gauge goes over 90, you are again in extreme territory. The same rules of thumb as for the DSI applies here as well.
Third, I use Stochastics, which is another very simple way to measure a markets momentum. Again same rule of thumb as above.
Fourth I use positioning.
Put / Call Ratio: High ratio = fear. Low = greed.
Commitment of Traders (COT) Reports: Tracks how commercial and non-commercial traders are positioned in futures.
When everyone is on the same side, there is no guarantee there will be a reversal.
But it does tell you if a reverseal comes, the move can get violent. Quickly.
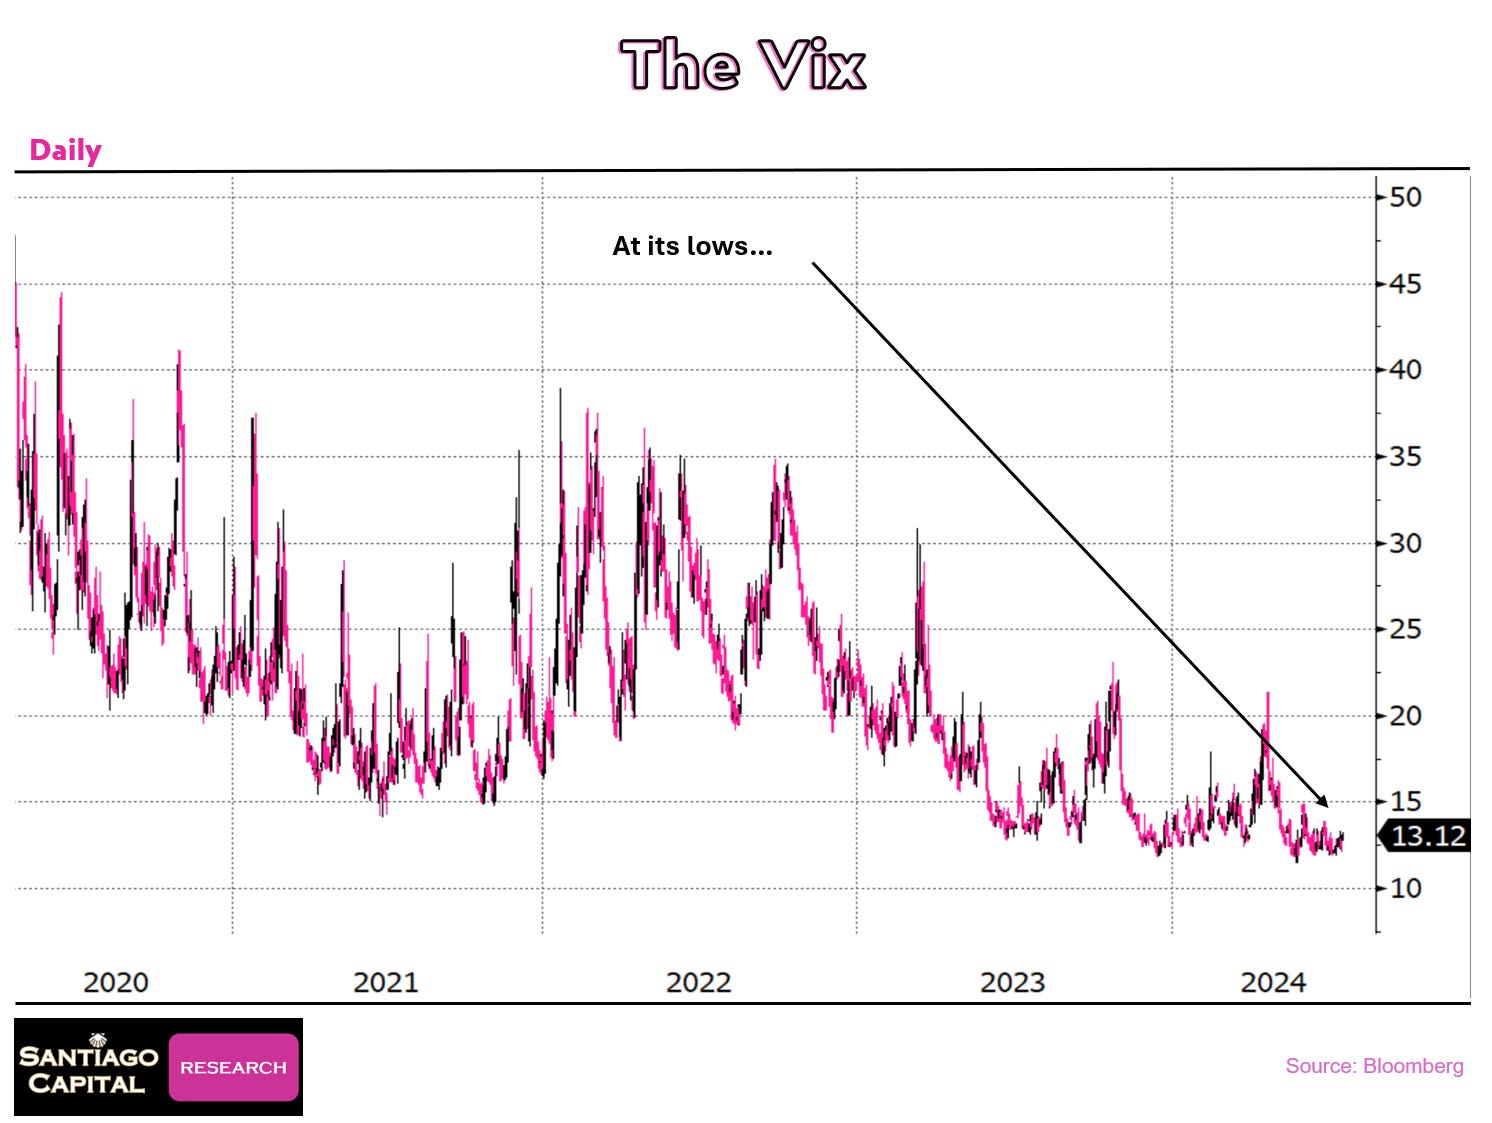
And finally, I use the VIX as a simple measure of whether the market is fearful or fearless.
Any of these indicators, when used in isolation, are arguably not important enough to warrant action. But when used together, they provide a very powerful mosaic that helps remove emotion that is often associated with a hard trending market.
In other words, when positioning lines up with extreme sentiment and volatility divergences?
You are getting close to a trade…
Step 5: Identifying the Setup
But going back to Step 2 above…why did I have short positions on the first place?
Wasn’t the market in the middle of a huge Bull run?
Indeed it had been.
But there was a few days in mid July where every one of the signals identified above were flashing RED while surging higher. And they were all saying the same thing.
Overbought.
In 25 years of doing this job, I had never seen that total confluence before. Not once.
I didn’t know what the catalyst would be to turn the market lower, I just knew the market could not get more extreme than it already was.
And my non emotional process demanded action prior to a catalyst becoming obvious.
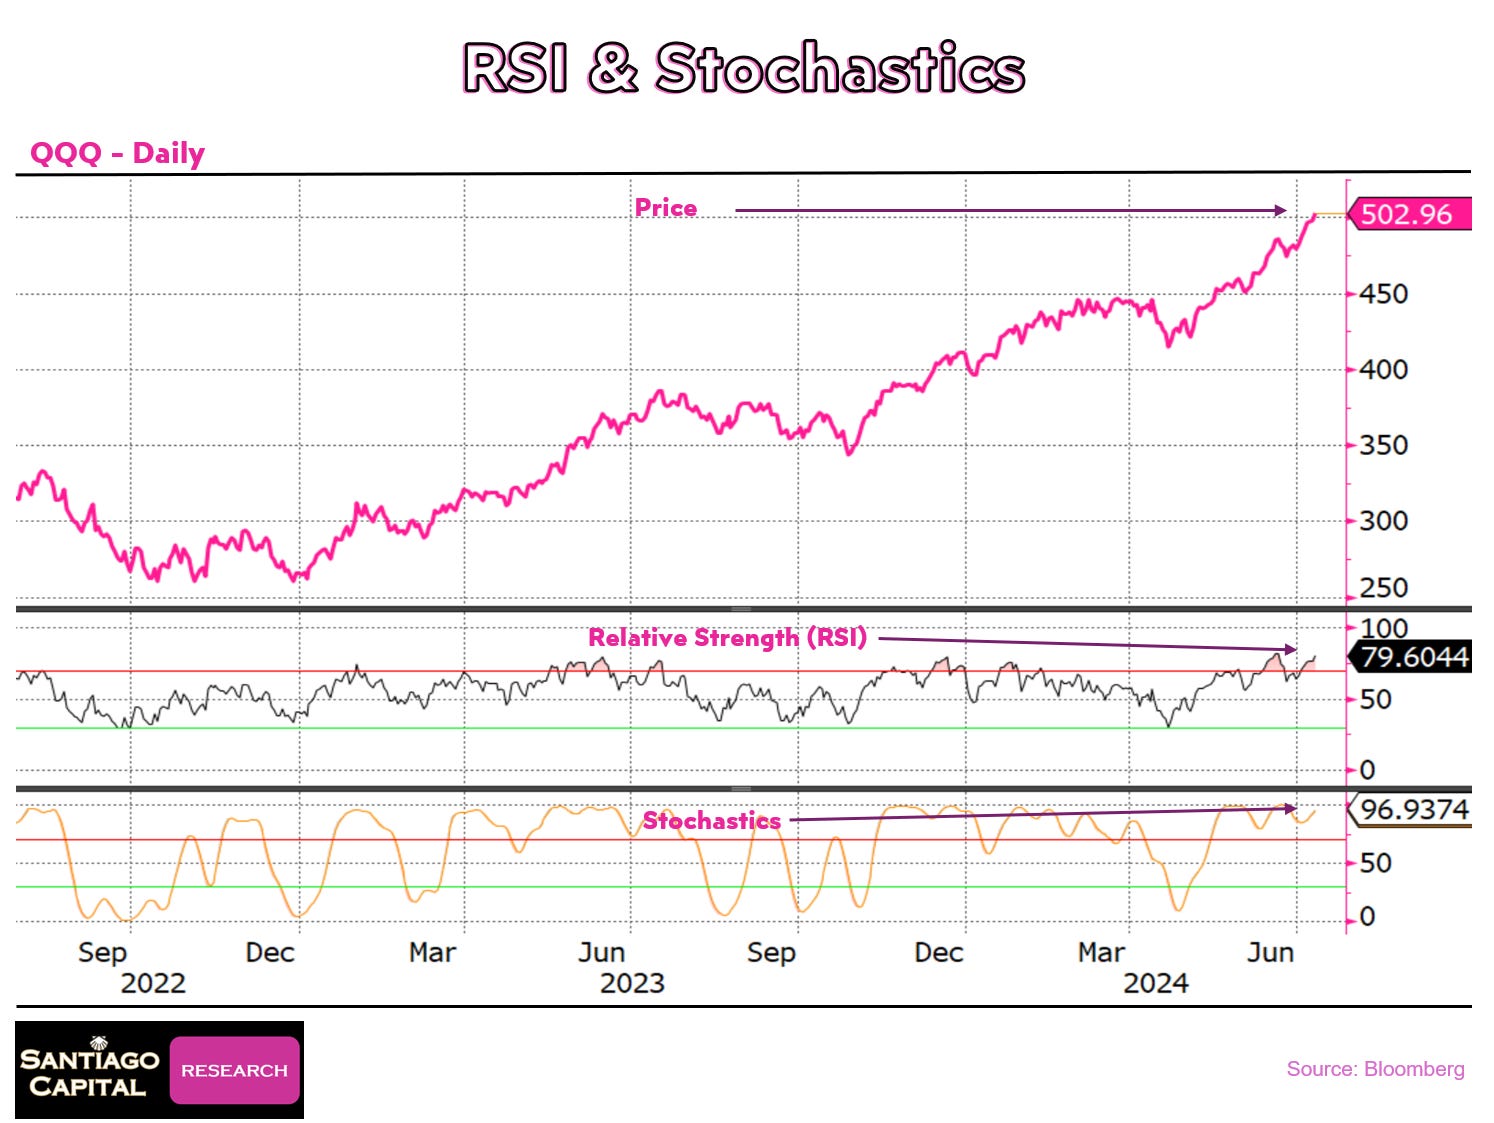
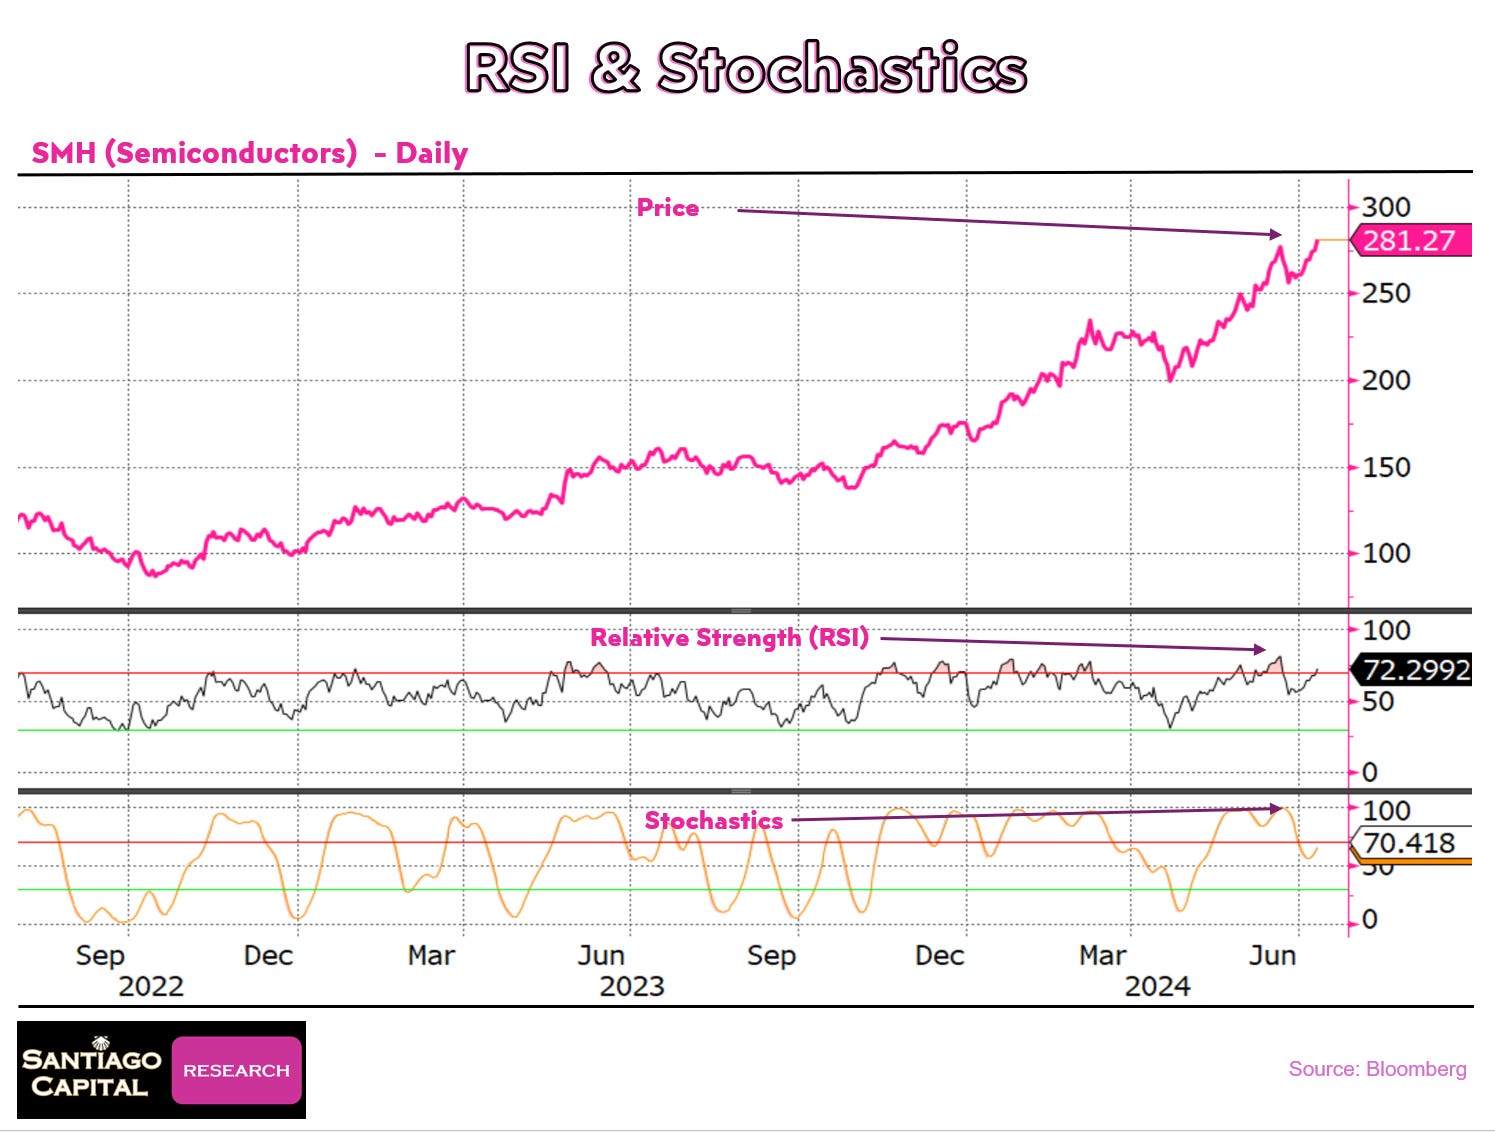
Next, we take a closer look at those signals with regards the S&P500, the Nasdaq, and Semiconductors, which demanded that action be taken.
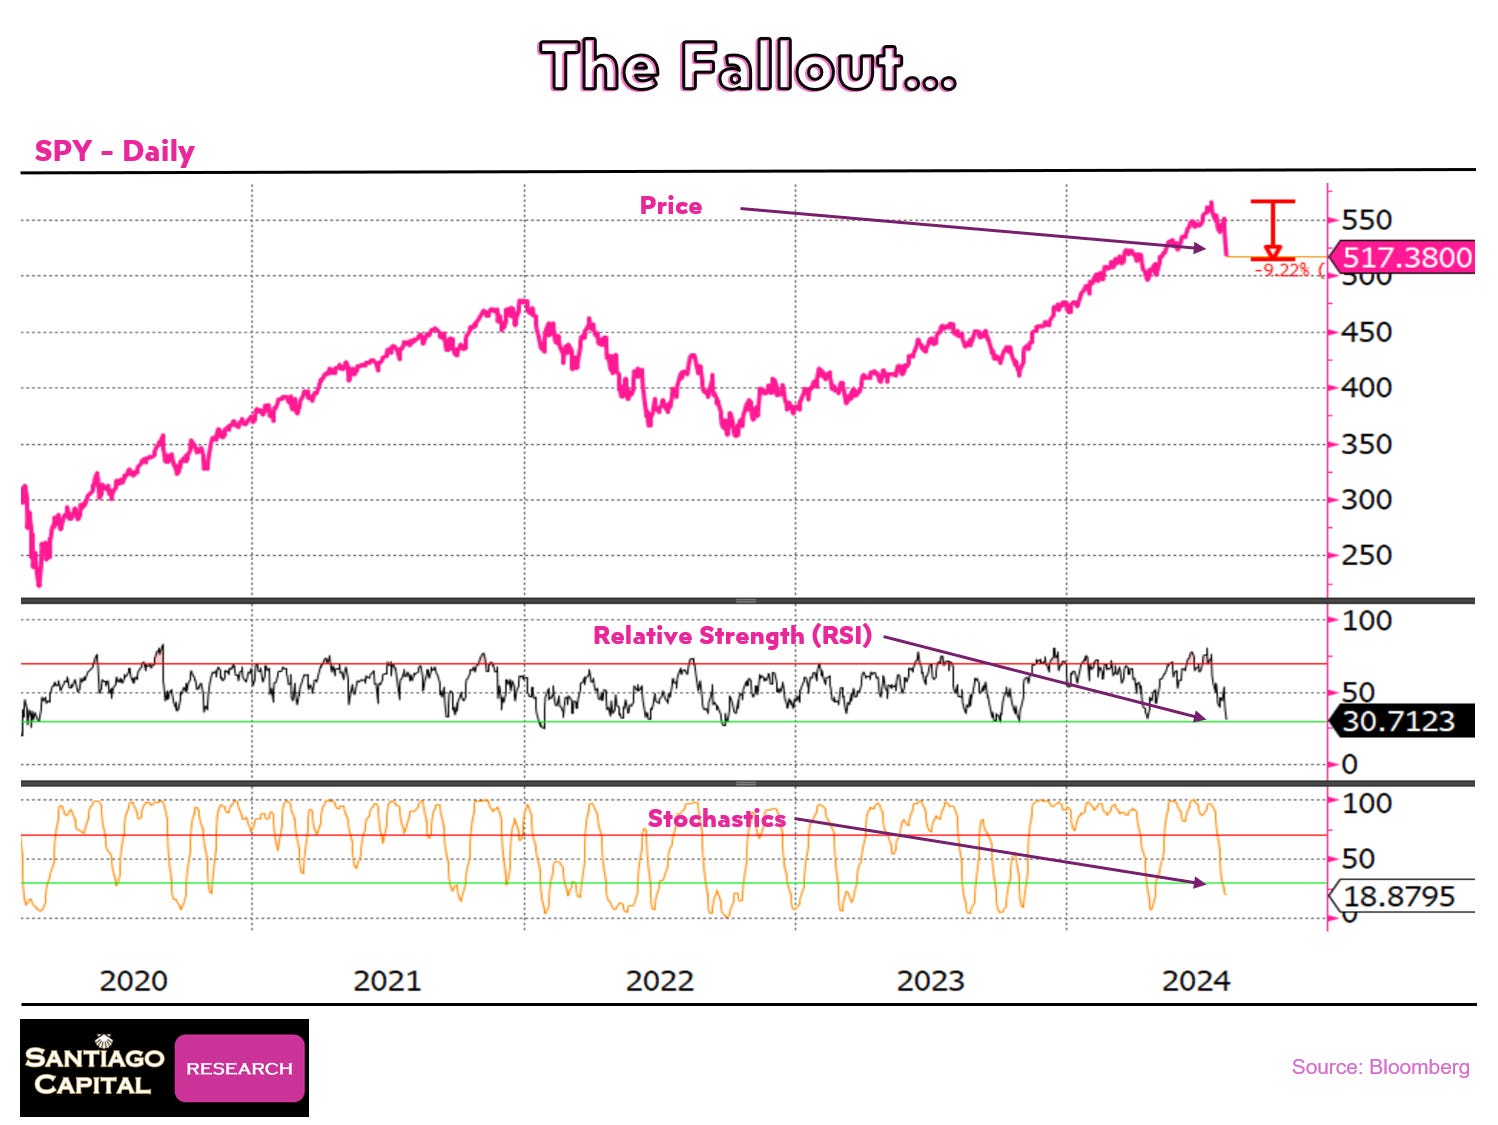
Below are the charts for the proxies of these three markets, specifically the SPY, QQQ, SMH ETFs showing the Price, Relative Strength, and Stochastics in early July 2024.
And below we can see both the Put / Call Ratio and the Vix for the same time period.
In short, I didn’t know for sure there would be a reversal.
But I did know the table was set for one, that the odds were now on my side, and that I wanted profit should a catalyst for lower prices appear.
Step 6: Executing the Trade
Here is a summary of how I entered those trades:
Waited for multiple signals to align (volatility, sentiment, relative strenth, stochastics, positioning)
I did not “guess” we were at the top —I just let my signals hit extremes.
Used Put Options. These were cheap due to the low Vix and extremely bullish sentiment. They also have the added bonus of providing leveraged upside while at the same time providing a max loss, and as such clearly defined risk parameters in the event I was wrong.
And then I waited.
It didn’t take long…
The Catalyst
Donald Trump, the frontrunner for the upcoming US Presidential election, commented on the need for Taiwan to pay for the protection the US was providing them.
Because Taiwan dominates the semiconductor manufacturing space, and because both the S&P500 and Nasdaq were being dominated by technology stocks, and specifically semiconductors, this was enough to trigger a reversal.
Then, as luck would have it, fear of a Yen Carry Trade blow up appeared at the end of July. This exacerbated the fear in the market and accelerated our short exposure higher still.
The point here is that the I didn’t know what the catalyst (or catalysts) would be.
But when the set up is there, you need to take it.
Because if you wait for the catalyst to identify itself with perfect clarity, the opportunity may already be gone.
Step 7: Managing the Fallout
Over the next three weeks following the initiation of the trades, dramatic reversals in global risk assets took place.
Below we show the impact on the SPY, QQQ, and SMH ETFs, as well as how our indicators changed during that same time period.
The SPY fell approximately 10% while its Relative Strength and Stochastics crashed.
The QQQ fell approximately 15% while its Relative Strength and Stochastics crashed.
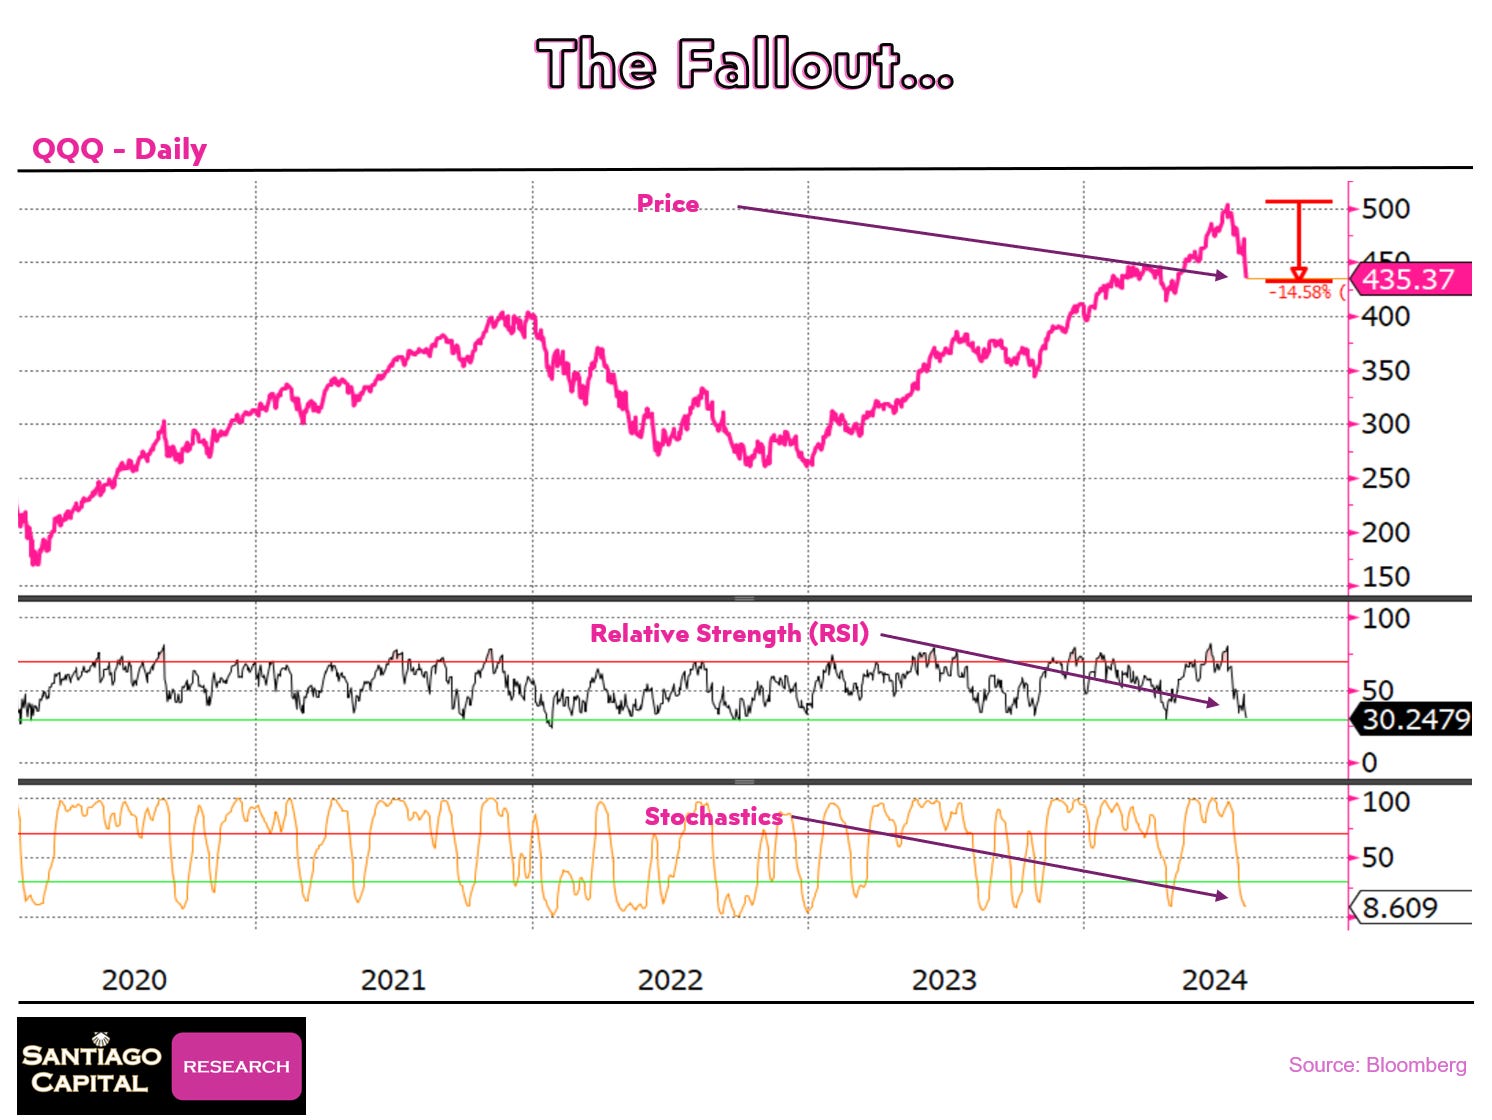
And SMH fell approximately 25% while its Relative Strength and Stochastics crashed.
In fact, the Relative Strength and Stochastics crashed so far that they were now at the levels where I would normally consider buying them.
This was my first indicator it was potentially time to close this trade.
Next I looked at the Vix and the Put Call Ratio.
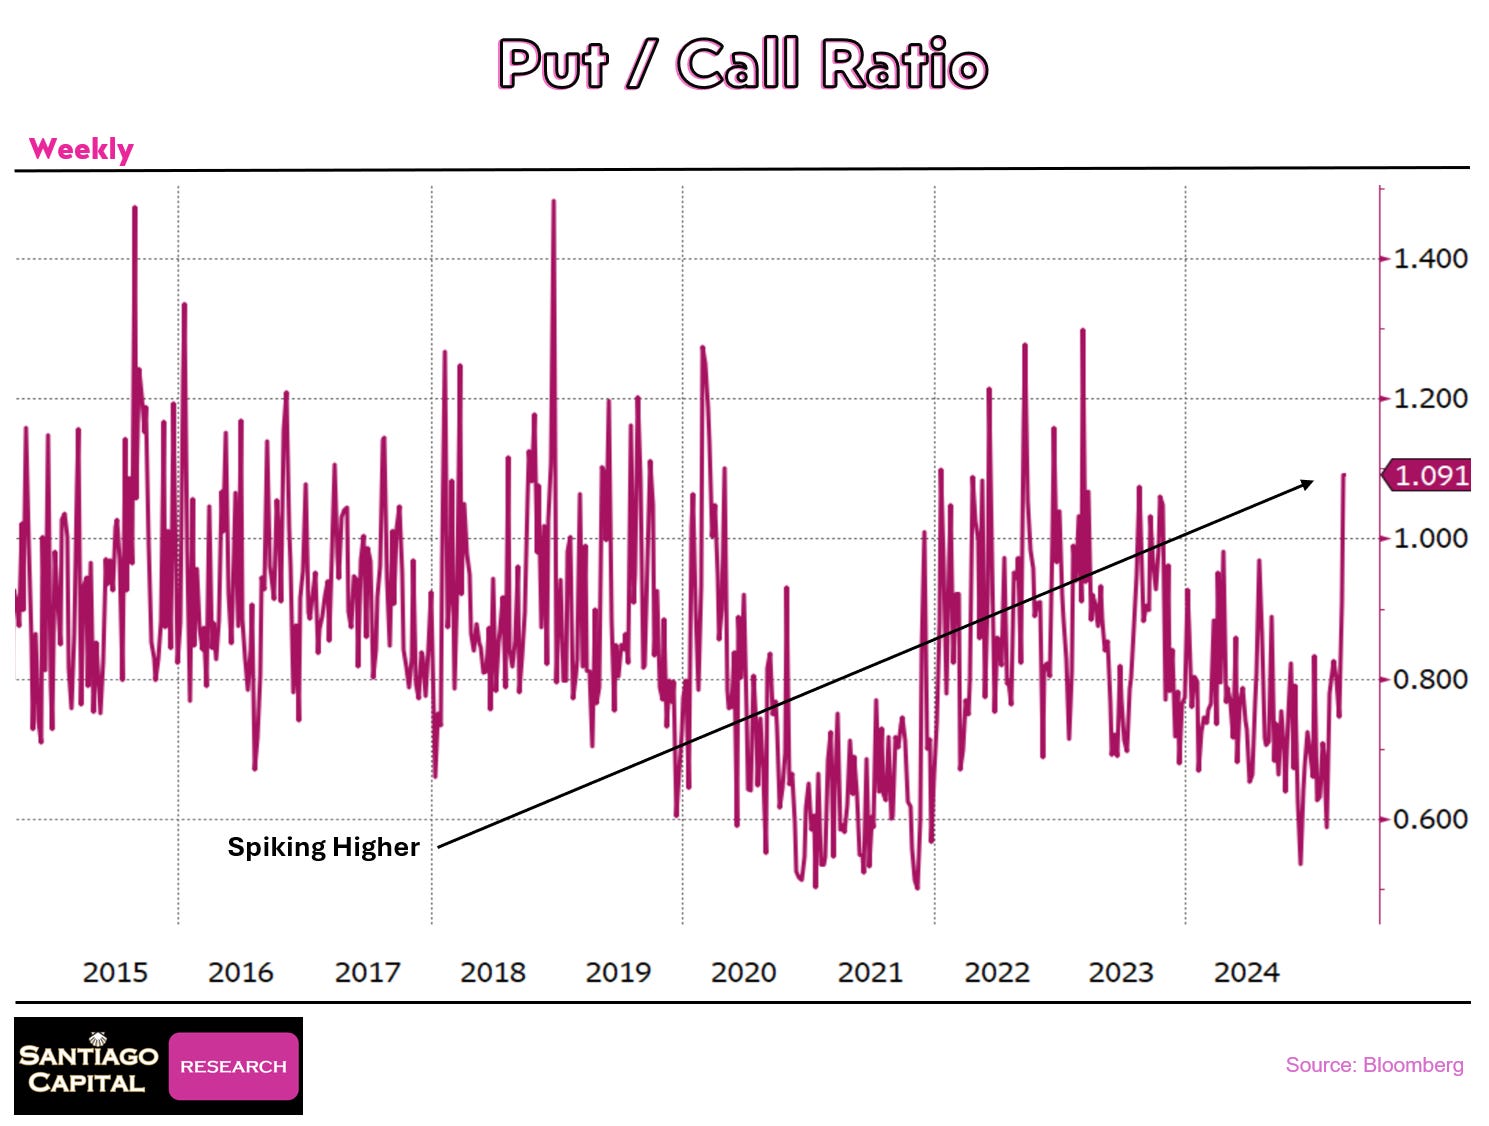
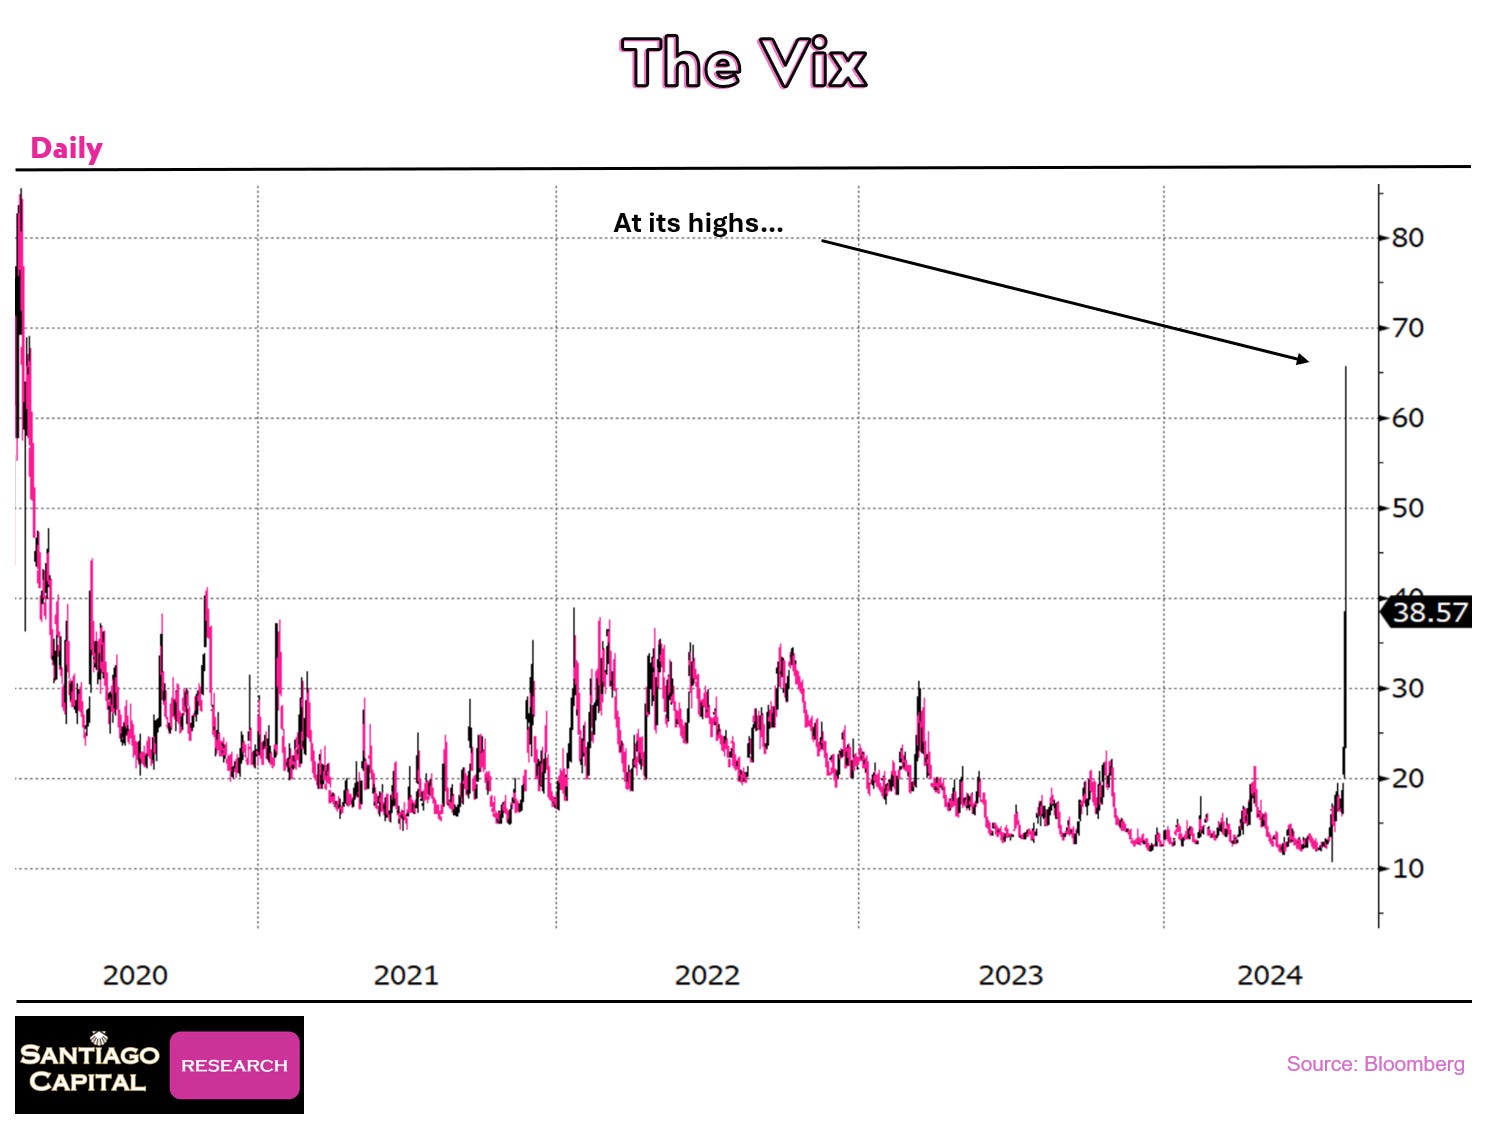
As you can see, both were spiking.
Investors were panicking.
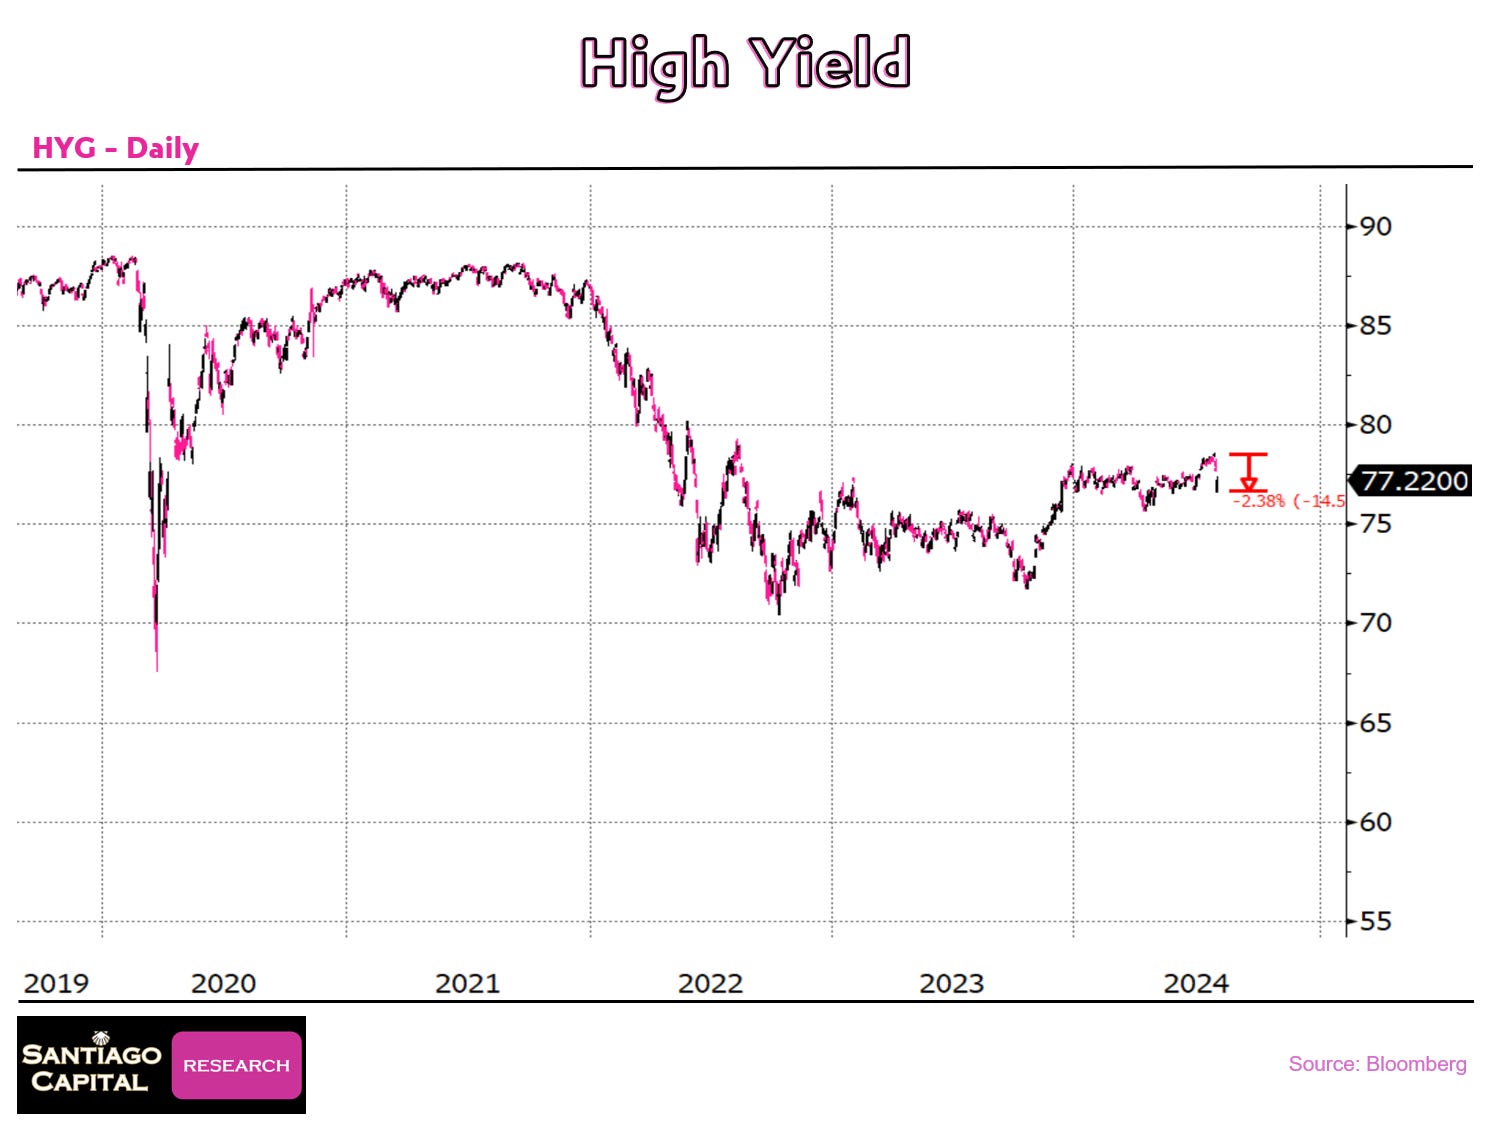
But when I looked at high yield (a proxy for credit spreads) it was off, but only by 2% and it didn’t seem to be accelerating.
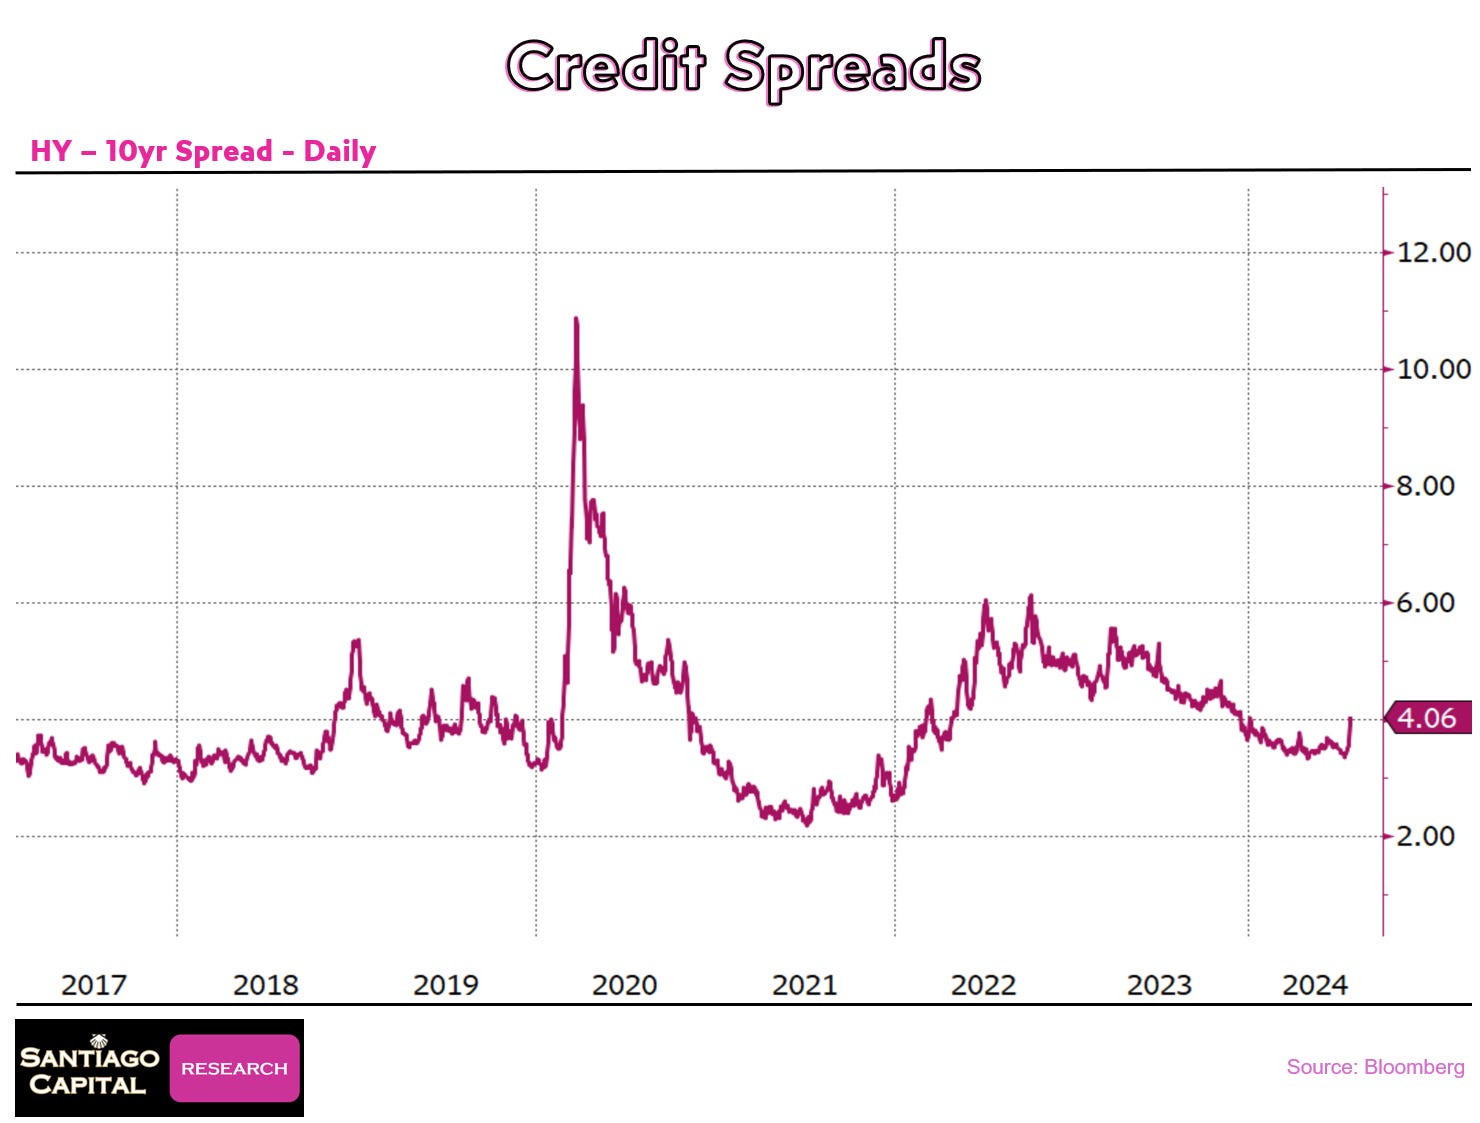
And when I looked at Credit Spreads themselves, even though they were rising, they were still fairly tight from a historical perspective and did not appear to be reflecting a surging panic higher.
So as I surveyed the current landscape, had I not just experienced the panic and emotion of the last few weeks, and instead just unemotionally viewed the current data, the indicators were now saying it would not only be a horrible time to enter a short position, but the indicators were saying it would not be a horrible time to buy.
It was time to exit most of my short positions.
This is where having used Put Options came in handy.
Because of their inherent leverage, and because they become more expensive as the Vix rises, these positions were now up massively. And it was very easy to take not only the initial capital off the table, but also to lock in substantial profit, while still keeping some small exposure if there was further downside…for free.
I was now mostly out of the position, had booked some good profits to use in the future, and would be playing any further downside with house money going forward.
This is where I believe I am different.
I don’t need to do every trade.
When I do trade, I don’t need to hit every trade perfectly.
Because of the asymmetry of the trades I do, when I’m right, I can make a lot very quickly. And when I’m wrong, I don’t get rekt.
“The best trades are asymmetric. I risk a little to make a lot—but only when the odds line up.”
And then I trim when trades go my way.
When using options that have inherent leverage, I take my initial capital off the table as soon as I can. Then I step away when the signals I used to enter the trade have reversed.
Then I sit on the sidelines and wait for the next set up to arrive.
The Real Edge? Discipline
Don’t copy my trades. Copy my process. Or create an repeatable process of your own.
Build a macro framework (your map).
Use indicators to assess sentiment and stress (your signals).
Wait for alignment. Don’t rush.
Size positions based on probability.
Let the market show its hand.
Don’t marry trades.
Rinse. Repeat. Survive.
This isn’t TikTok finance.
It’s professional discipline.
Final Sip: The Market Has No Sympathy
I never asks the market to agree with me.
It does not care what i think, how I feel, or what I want to see happen.
Wait for it to overreact...so you can take the other side.
Your edge is emotional discipline and probabilistic thinking.
And the secret weapon? Don’t trade noise. Trade setups.
When someone say’s “the dollar’s going to zero” or “the Fed has lost control,” ask yourslef:
“Cool. What’s the VIX doing? What’s credit saying? What’s positioning look like?”
Odds are, that will give you a much better view than the latest headline, tweet or blogpost.
⁉️ Haven’t caught our latest professional-level research?
