

HEADLINE: The Dashboard Is Flashing. Here’s What It’s Actually Telling You.
SUBHEADLINE: Gold above $5,000. Oil above $100. VIX at 27 and climbing. The dollar back above 100. When four indicators move in the same direction at the same time, you’re not looking at noise ... you’re looking at a signal.

The hot takes are flying again. Every pundit has an explanation. Every algorithm has a trade. And somewhere in the middle of all that noise, the market is actually trying to tell you something...if you know how to listen.
Let’s cut through it.
Gold above $5,000 per ounce. Oil crossing $100 per barrel. The CBOE Volatility Index at 27 and climbing. The U.S. Dollar Index back through 100. These four things don’t move together by accident. When you see them all moving in the same direction at once, you’re looking at a market that is either already in a crisis...or knocking very loudly on the door.
Now, the question worth asking isn’t whether these moves are real. They are. The question is: what are they actually telling you, and what do you do with it?
The VIX Is Only Telling You Half the Story
Start with the headline number. At 27, the VIX is elevated...but it’s not screaming. Put it in context: it hit 60 intraday last April during the tariff tantrum. Today’s reading, while meaningfully higher than the low-20s range we’ve been running in, isn’t extreme by any historical standard.
But here’s the thing...the headline VIX is not the right instrument to be watching right now.
What matters more is what’s happening underneath the surface. The skew on S&P 500 options ... which measures the relative cost of downside protection versus upside speculation ... is as elevated as it has been in 20 years.
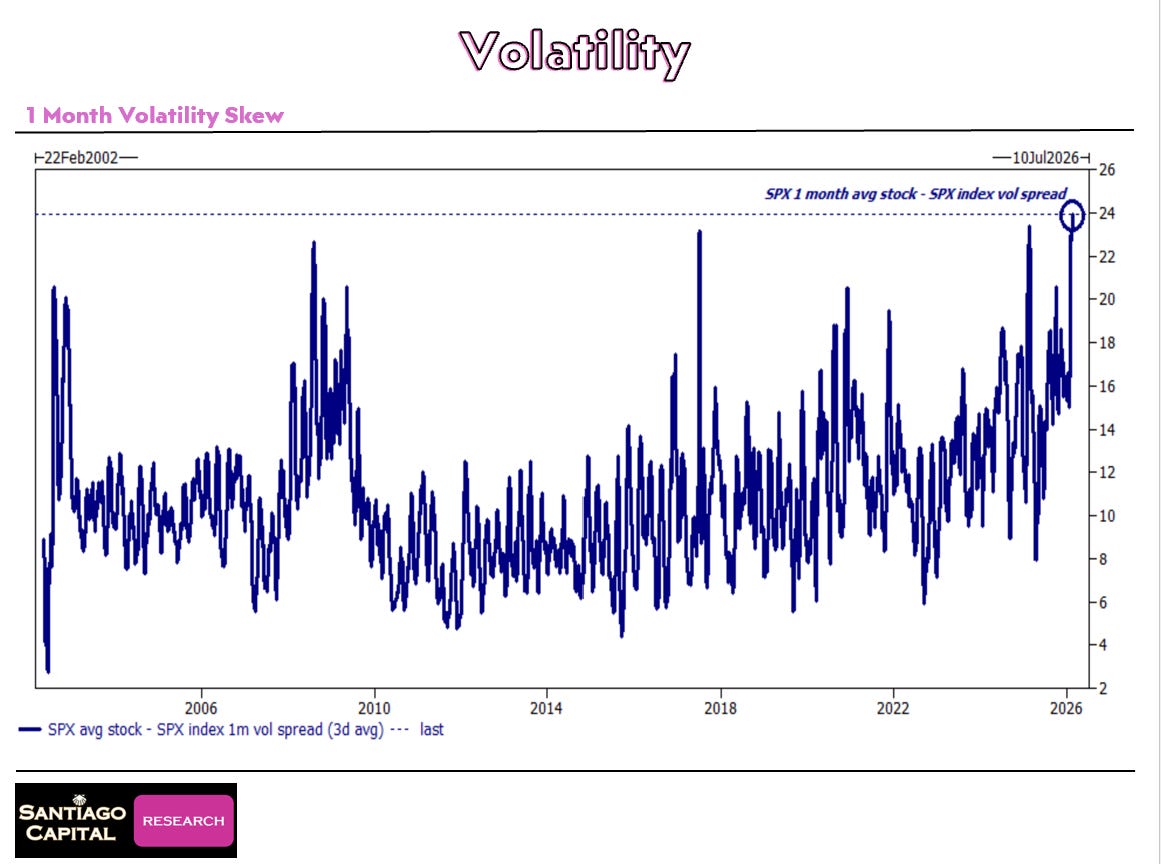
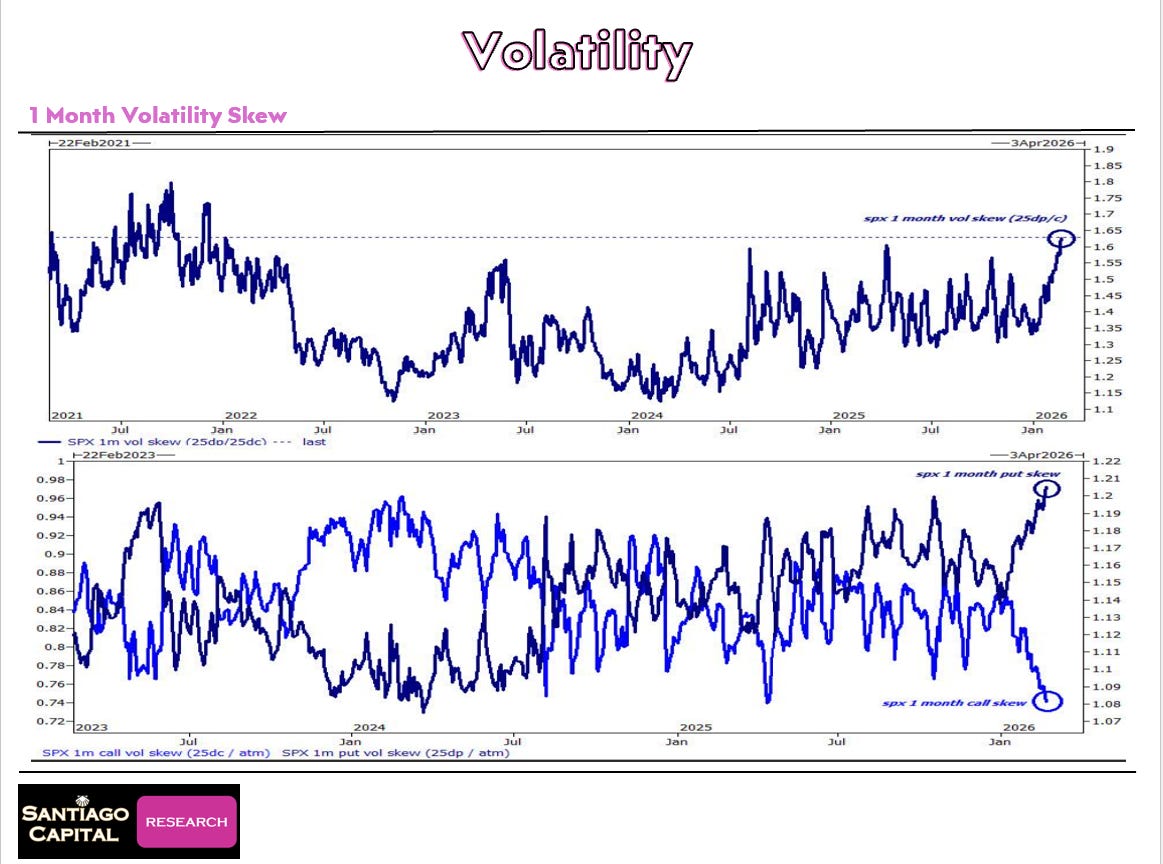
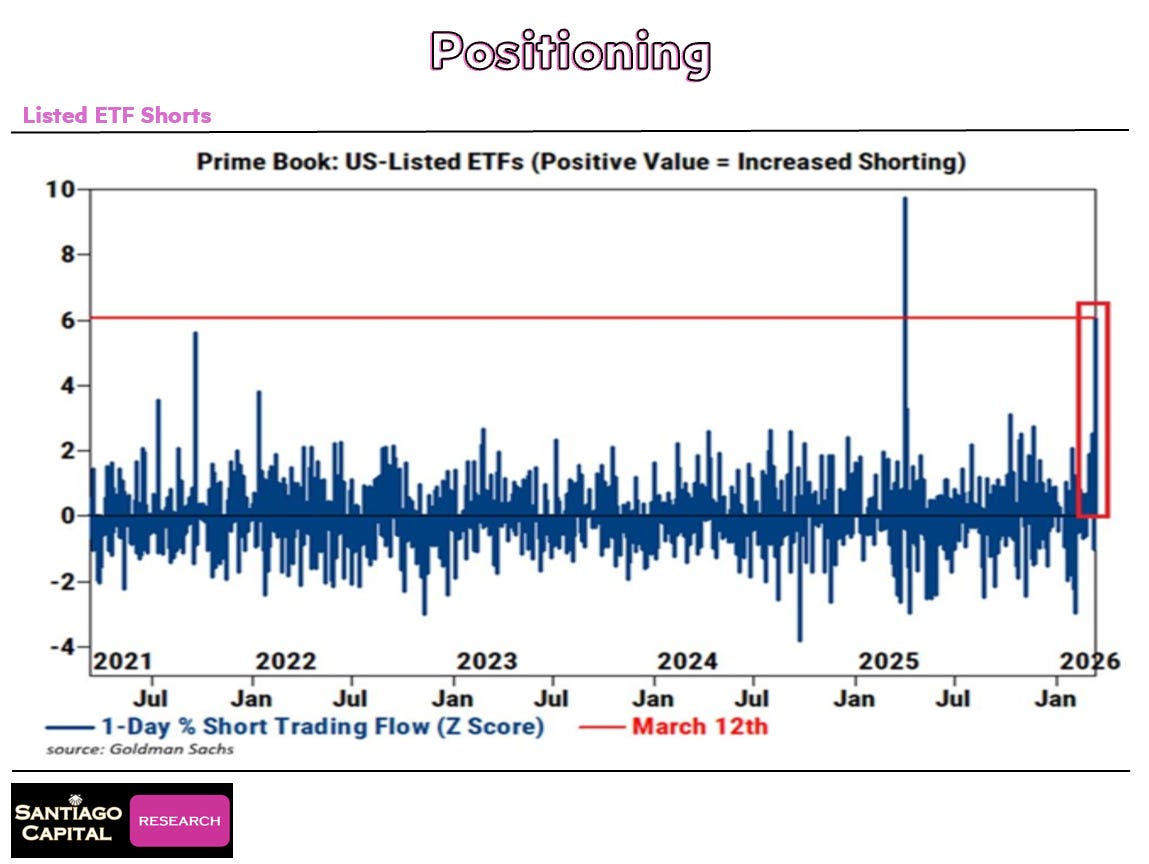
That means the fear embedded in market positioning is running far hotter than the headline number suggests. People aren’t just nervous. They are aggressively buying insurance against a sharp move lower. Put/call ratios, while not yet at last April’s extremes, are trending hard in that direction. Short positioning on broad ETFs is near multi-year highs outside of that same April window.
What does all of this add up to? Sentiment is low. Positioning is starting to reflect genuine fear. But we are not yet at the kind of capitulation extremes that typically mark a durable bottom. Daily sentiment readings for equities are sitting in the 30s...not the single digits you’d want to see at a true washout. Volatility sentiment, rather than sitting in the 80s or 90s where you’d expect at a real peak in fear, is in the high 50s to low 60s.
The market is scared. It hasn’t fully priced in the worst case yet.
That gap is important.

