
Why Bonds Stopped Working
The 60/40 portfolio's foundational assumption broke down four years ago. Most investors haven't adjusted.


When stocks go down, bonds go up.
That sentence has been the foundation of portfolio construction in the United States for forty years. It is the reason the 60/40 portfolio became the default. It is the assumption every target-date fund, balanced strategy, and pension allocator built into their model. And it stopped being true five years ago.
The portfolios most people are sitting in were designed for a world that does not exist anymore.
![[Section Divider Image]](https://substackcdn.com/image/fetch/$s_!nNBH!,f_auto,q_auto:good,fl_progressive:steep/https%3A%2F%2Fsubstack-post-media.s3.amazonaws.com%2Fpublic%2Fimages%2Fb2d8625b-8093-4a44-be50-a624cf7fb22e_1320x50.webp "[Section Divider Image]")
The 60/40 Promise That Just Broke
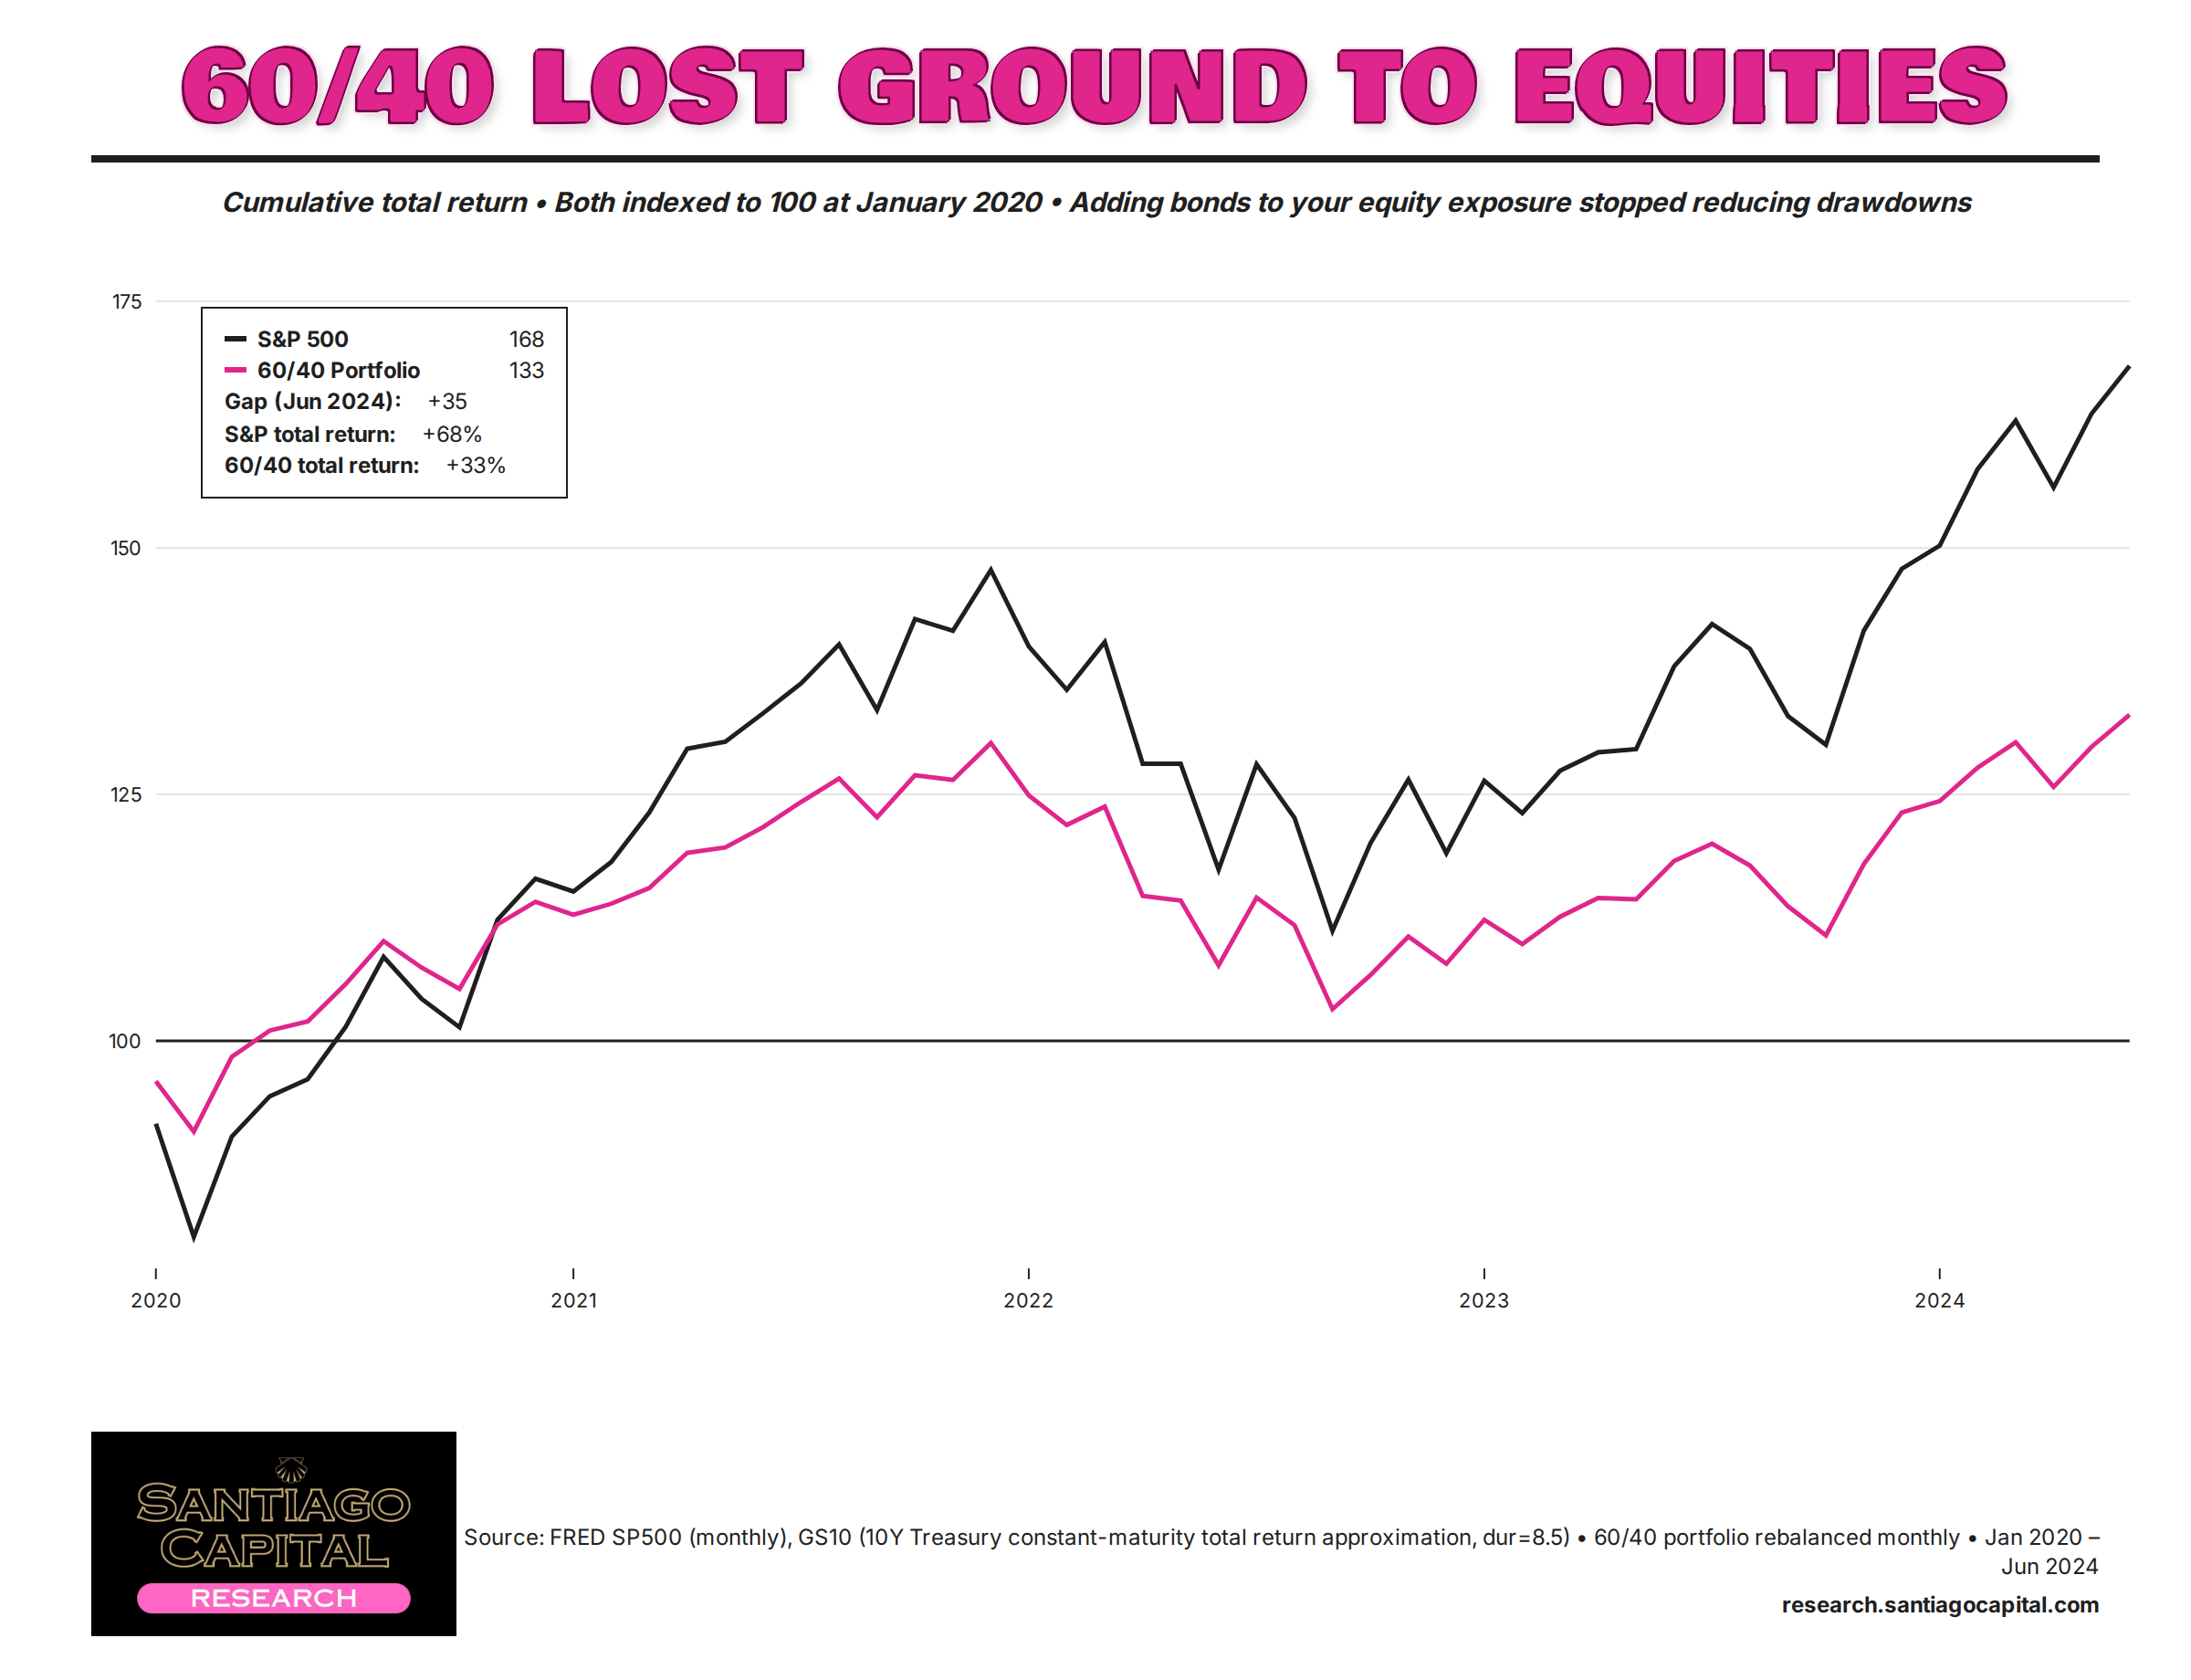
The 60/40 works because of one specific relationship between two assets. Stocks and bonds were historically negatively correlated. When equities sold off, Treasuries got bid. When the market panicked, the bond sleeve provided ballast. That was the deal you accepted when you took equity risk inside a balanced allocation.
That relationship inverted in early 2022. Stocks dropped 18% that year. Bonds dropped 13%. A standard 60/40 portfolio finished the year down roughly 16%, the worst calendar-year return in over four decades. And it is not happening because something unusual occurred. The structural conditions that produced negative stock-bond correlation no longer apply. The portfolio is operating in a different monetary regime than the one it was built for.
When Stock-Bond Correlation Flipped Positive
Look at the rolling twelve-month correlation between stock and bond returns over the post-2017 record. From the mid-1990s through 2020, the correlation spent most of its time in negative territory. That is the world the 60/40 was designed for. That is the world target-date glide paths assume. That is the world your financial advisor was trained inside.
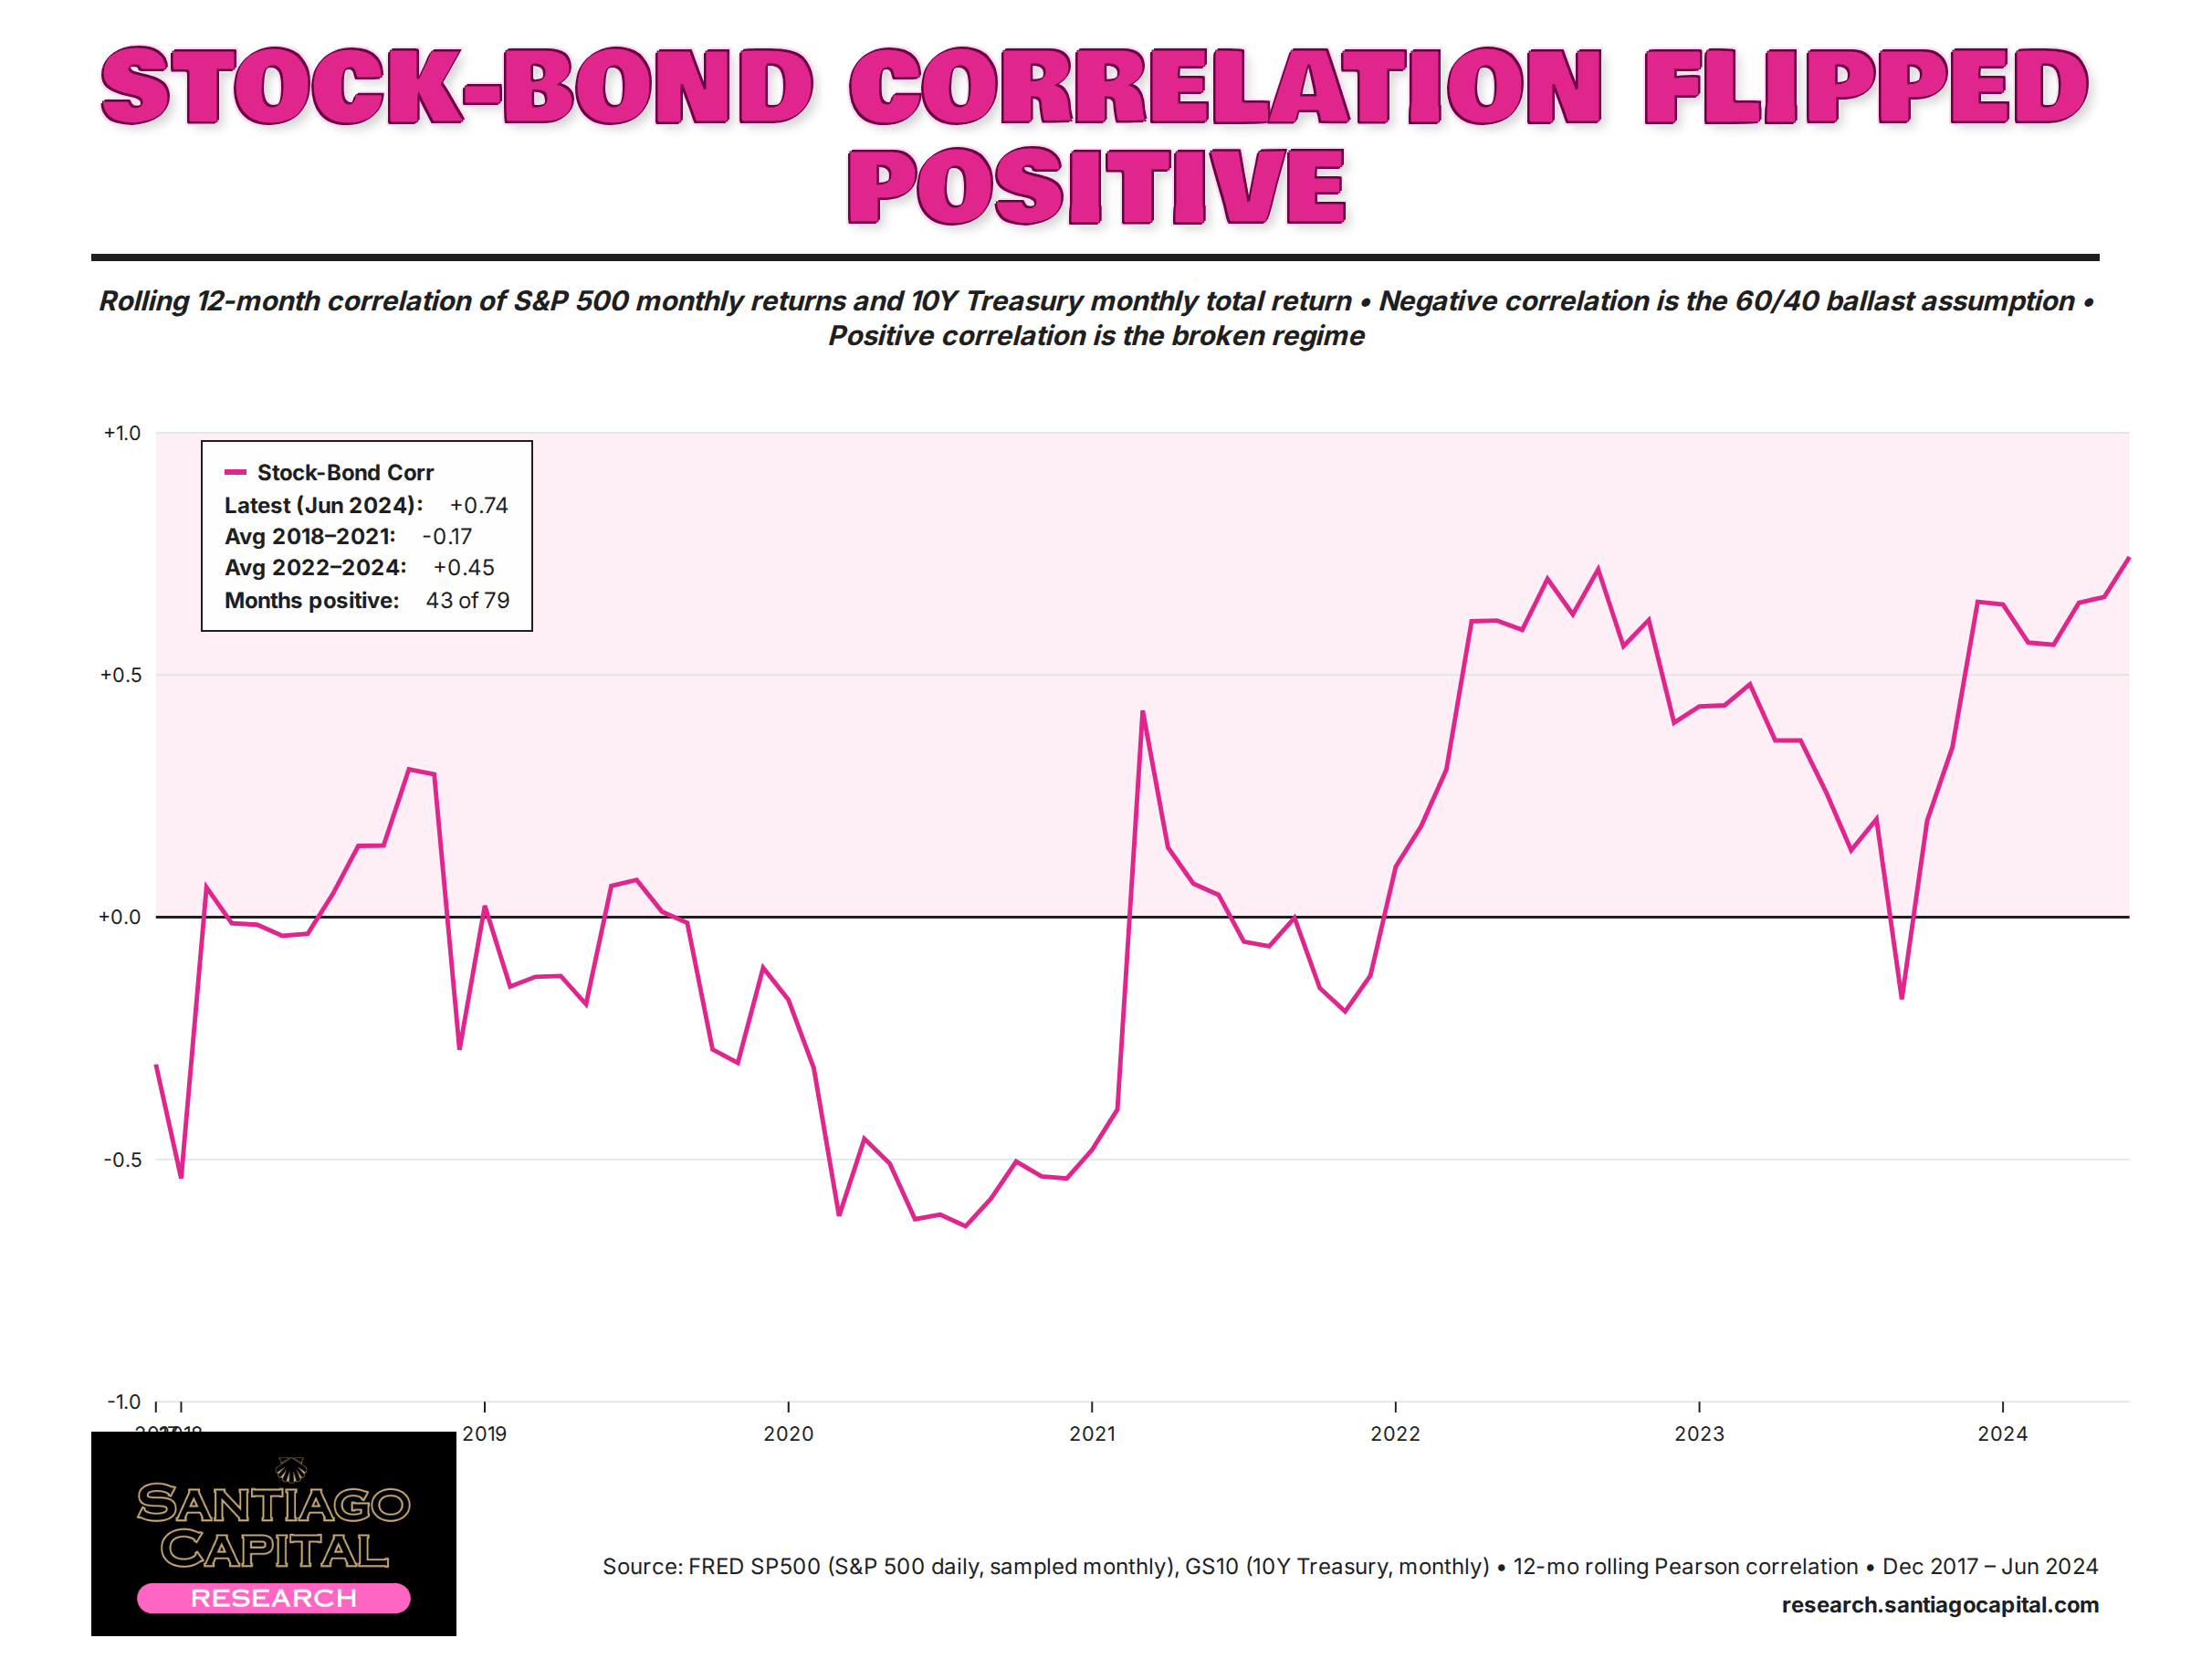
The correlation flipped positive in 2022 and has not come back. Stocks and bonds have moved in the same direction... up together, down together. The bond sleeve became another way to be long the same risk factor as the equity sleeve. The diversification benefit ran in reverse.
Why Both Sides of Your Portfolio Got Hit at Once
Negative stock-bond correlation only exists when growth risk dominates the cycle. In a growth scare, the Fed cuts, bonds rally, stocks fall. The two assets move opposite. That regime held from roughly 1998 through 2019.
Inflation regimes are different. When inflation drives the cycle, the Fed has to tighten regardless of what equities are doing. Higher policy rates push bond prices down. Higher discount rates compress equity multiples and push stocks down too. Both legs sell off at once because the same force is hitting both sides. There is no ballast because the ballast and the risk asset are responding to the same input.
It’s not that the 60/40 is bad construction. It worked beautifully under disinflationary monetary regimes. The problem is the regime changed and the portfolio did not.
The Yield Curve Inversion That Punished Bondholders
The yield curve has spent most of the last three years inverted, with two-year yields above ten-year yields. That inversion was the longest in modern U.S. history. It was also the empirical signature of a Fed running short rates well above where the bond market thought neutral lived.
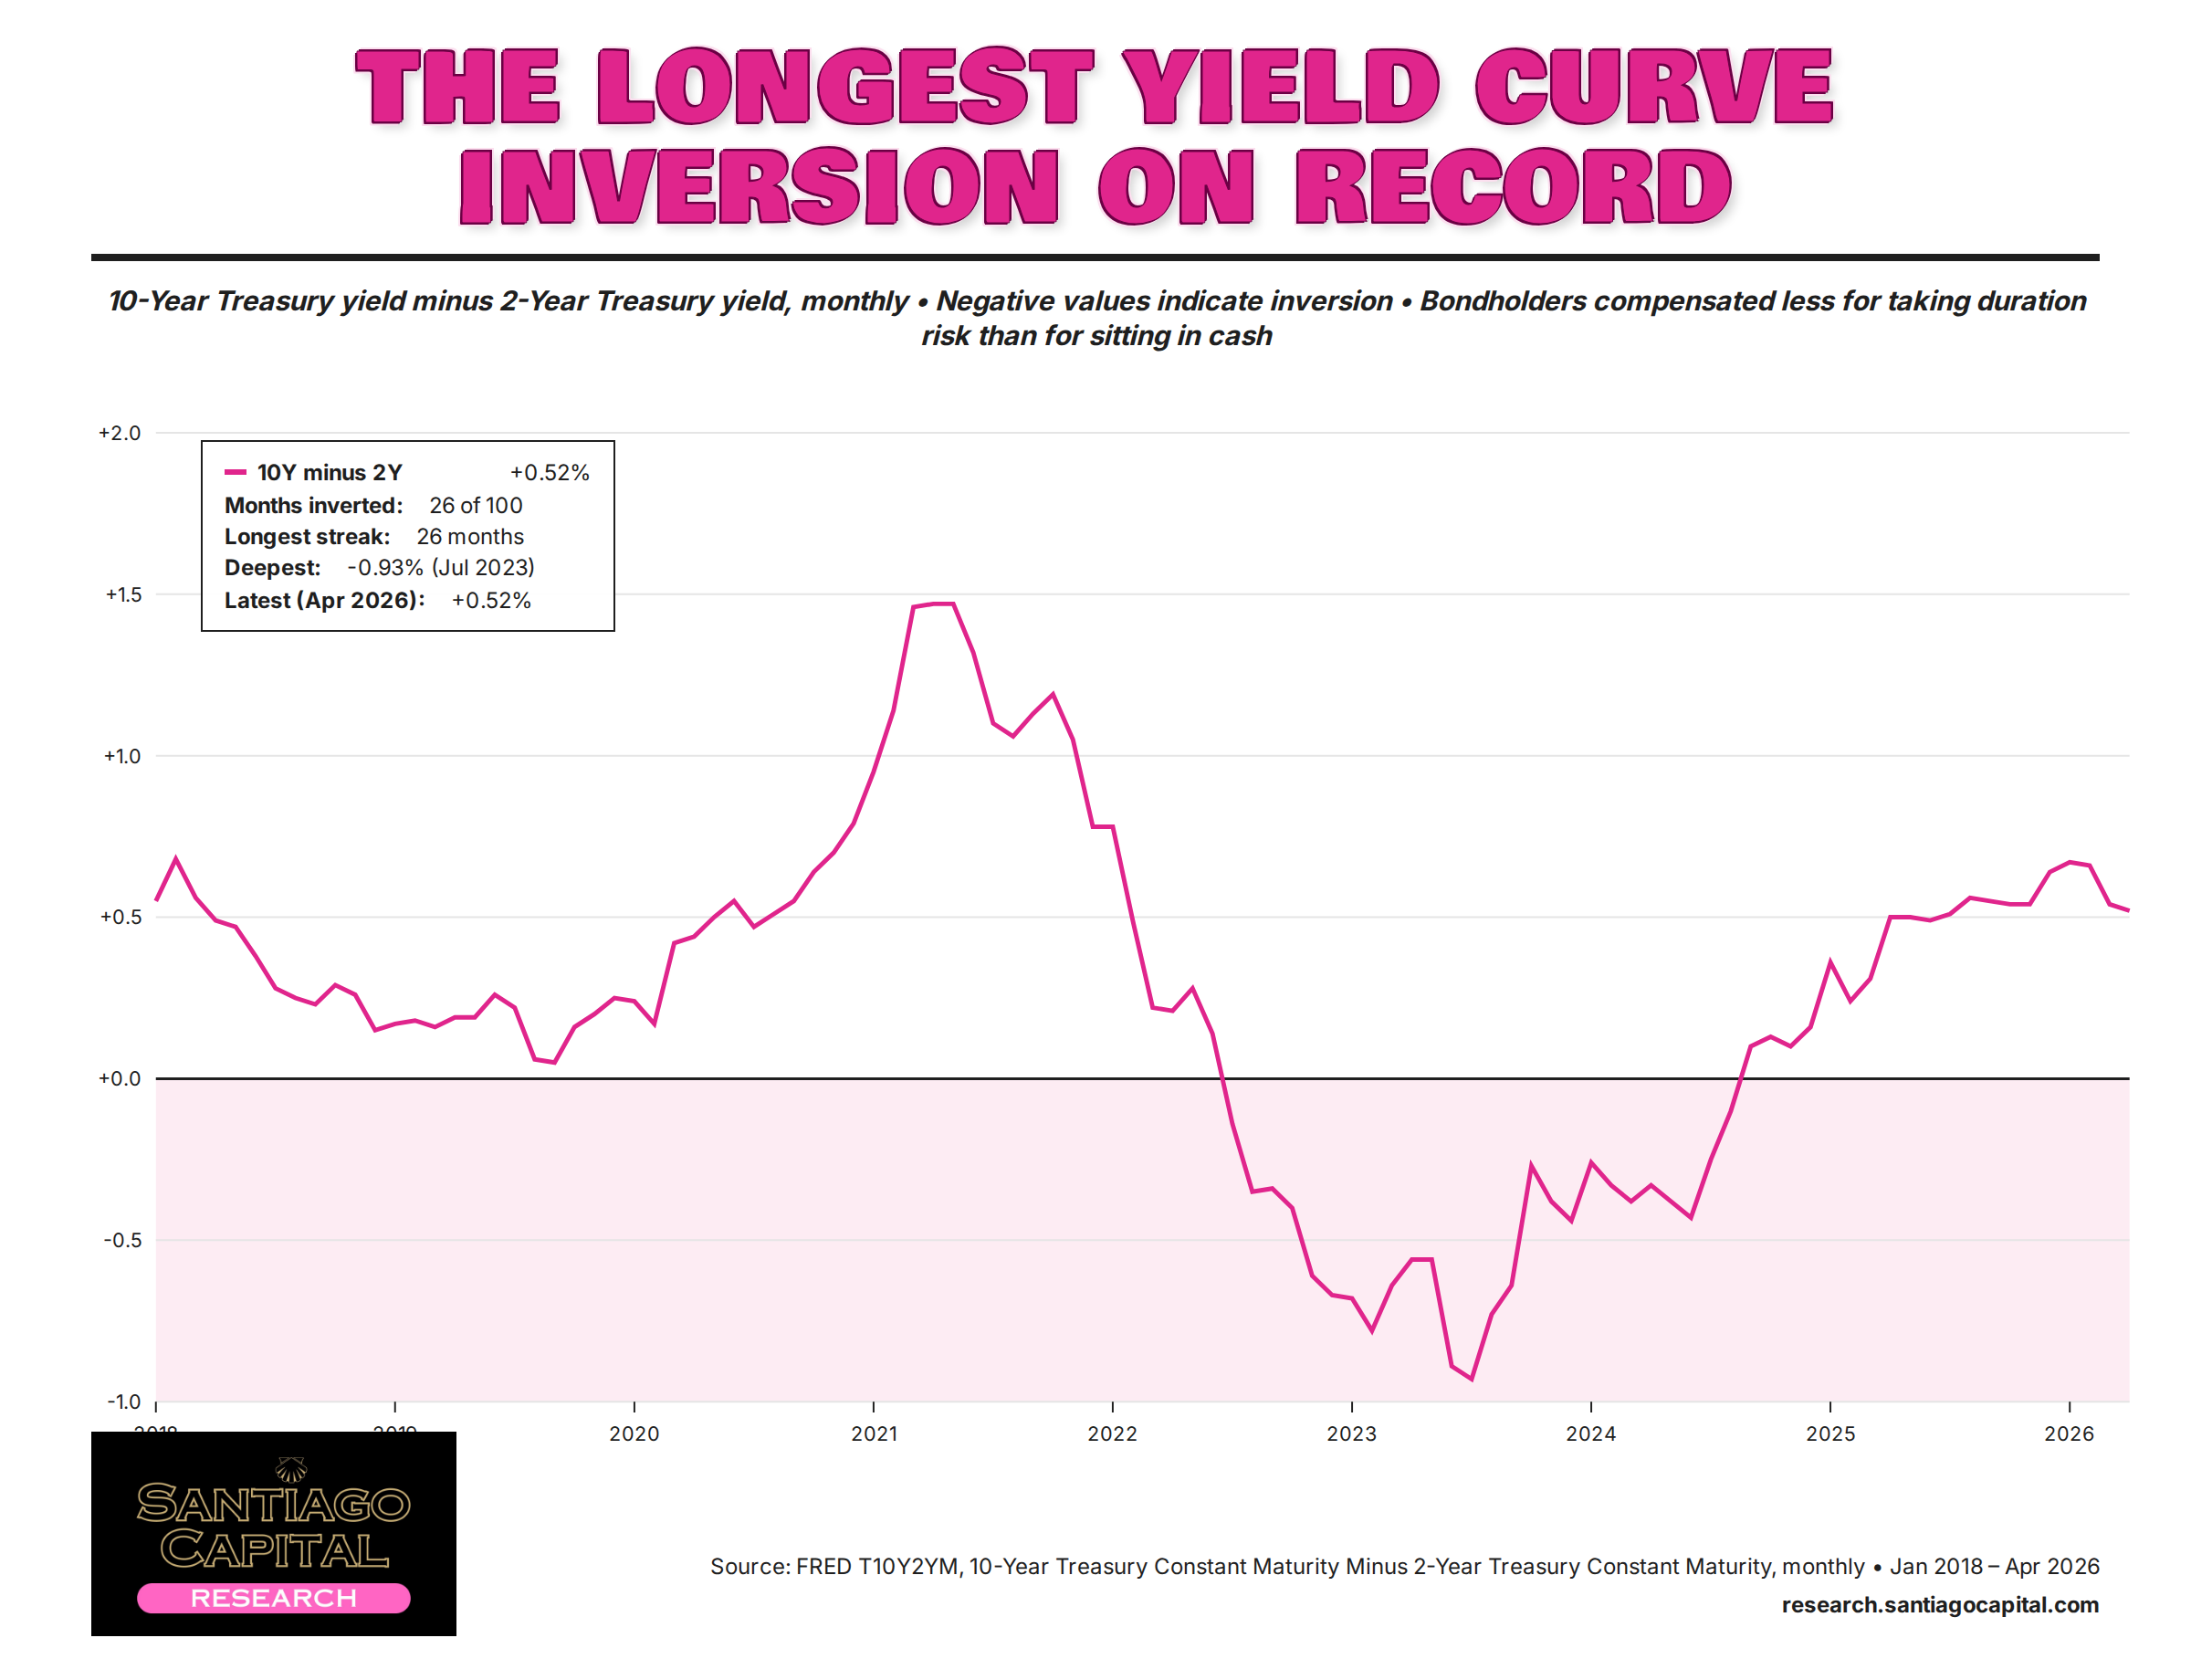
What that meant for portfolios was simple and brutal. Bondholders were paid less to take duration risk than to park in a money market fund. That is not a temporary distortion you can wait out. That is a structural pricing problem that lasts as long as the underlying inflation regime persists.
The Broader Map: Less Than Zero
The negative-real-yield environment that has crushed bonds is the same environment mapped in this week’s Less Than Zero report. The mechanism that punished bondholders is the same mechanism punishing savers. It is the same mechanism that has held real yields below zero for most of the post-2008 period.
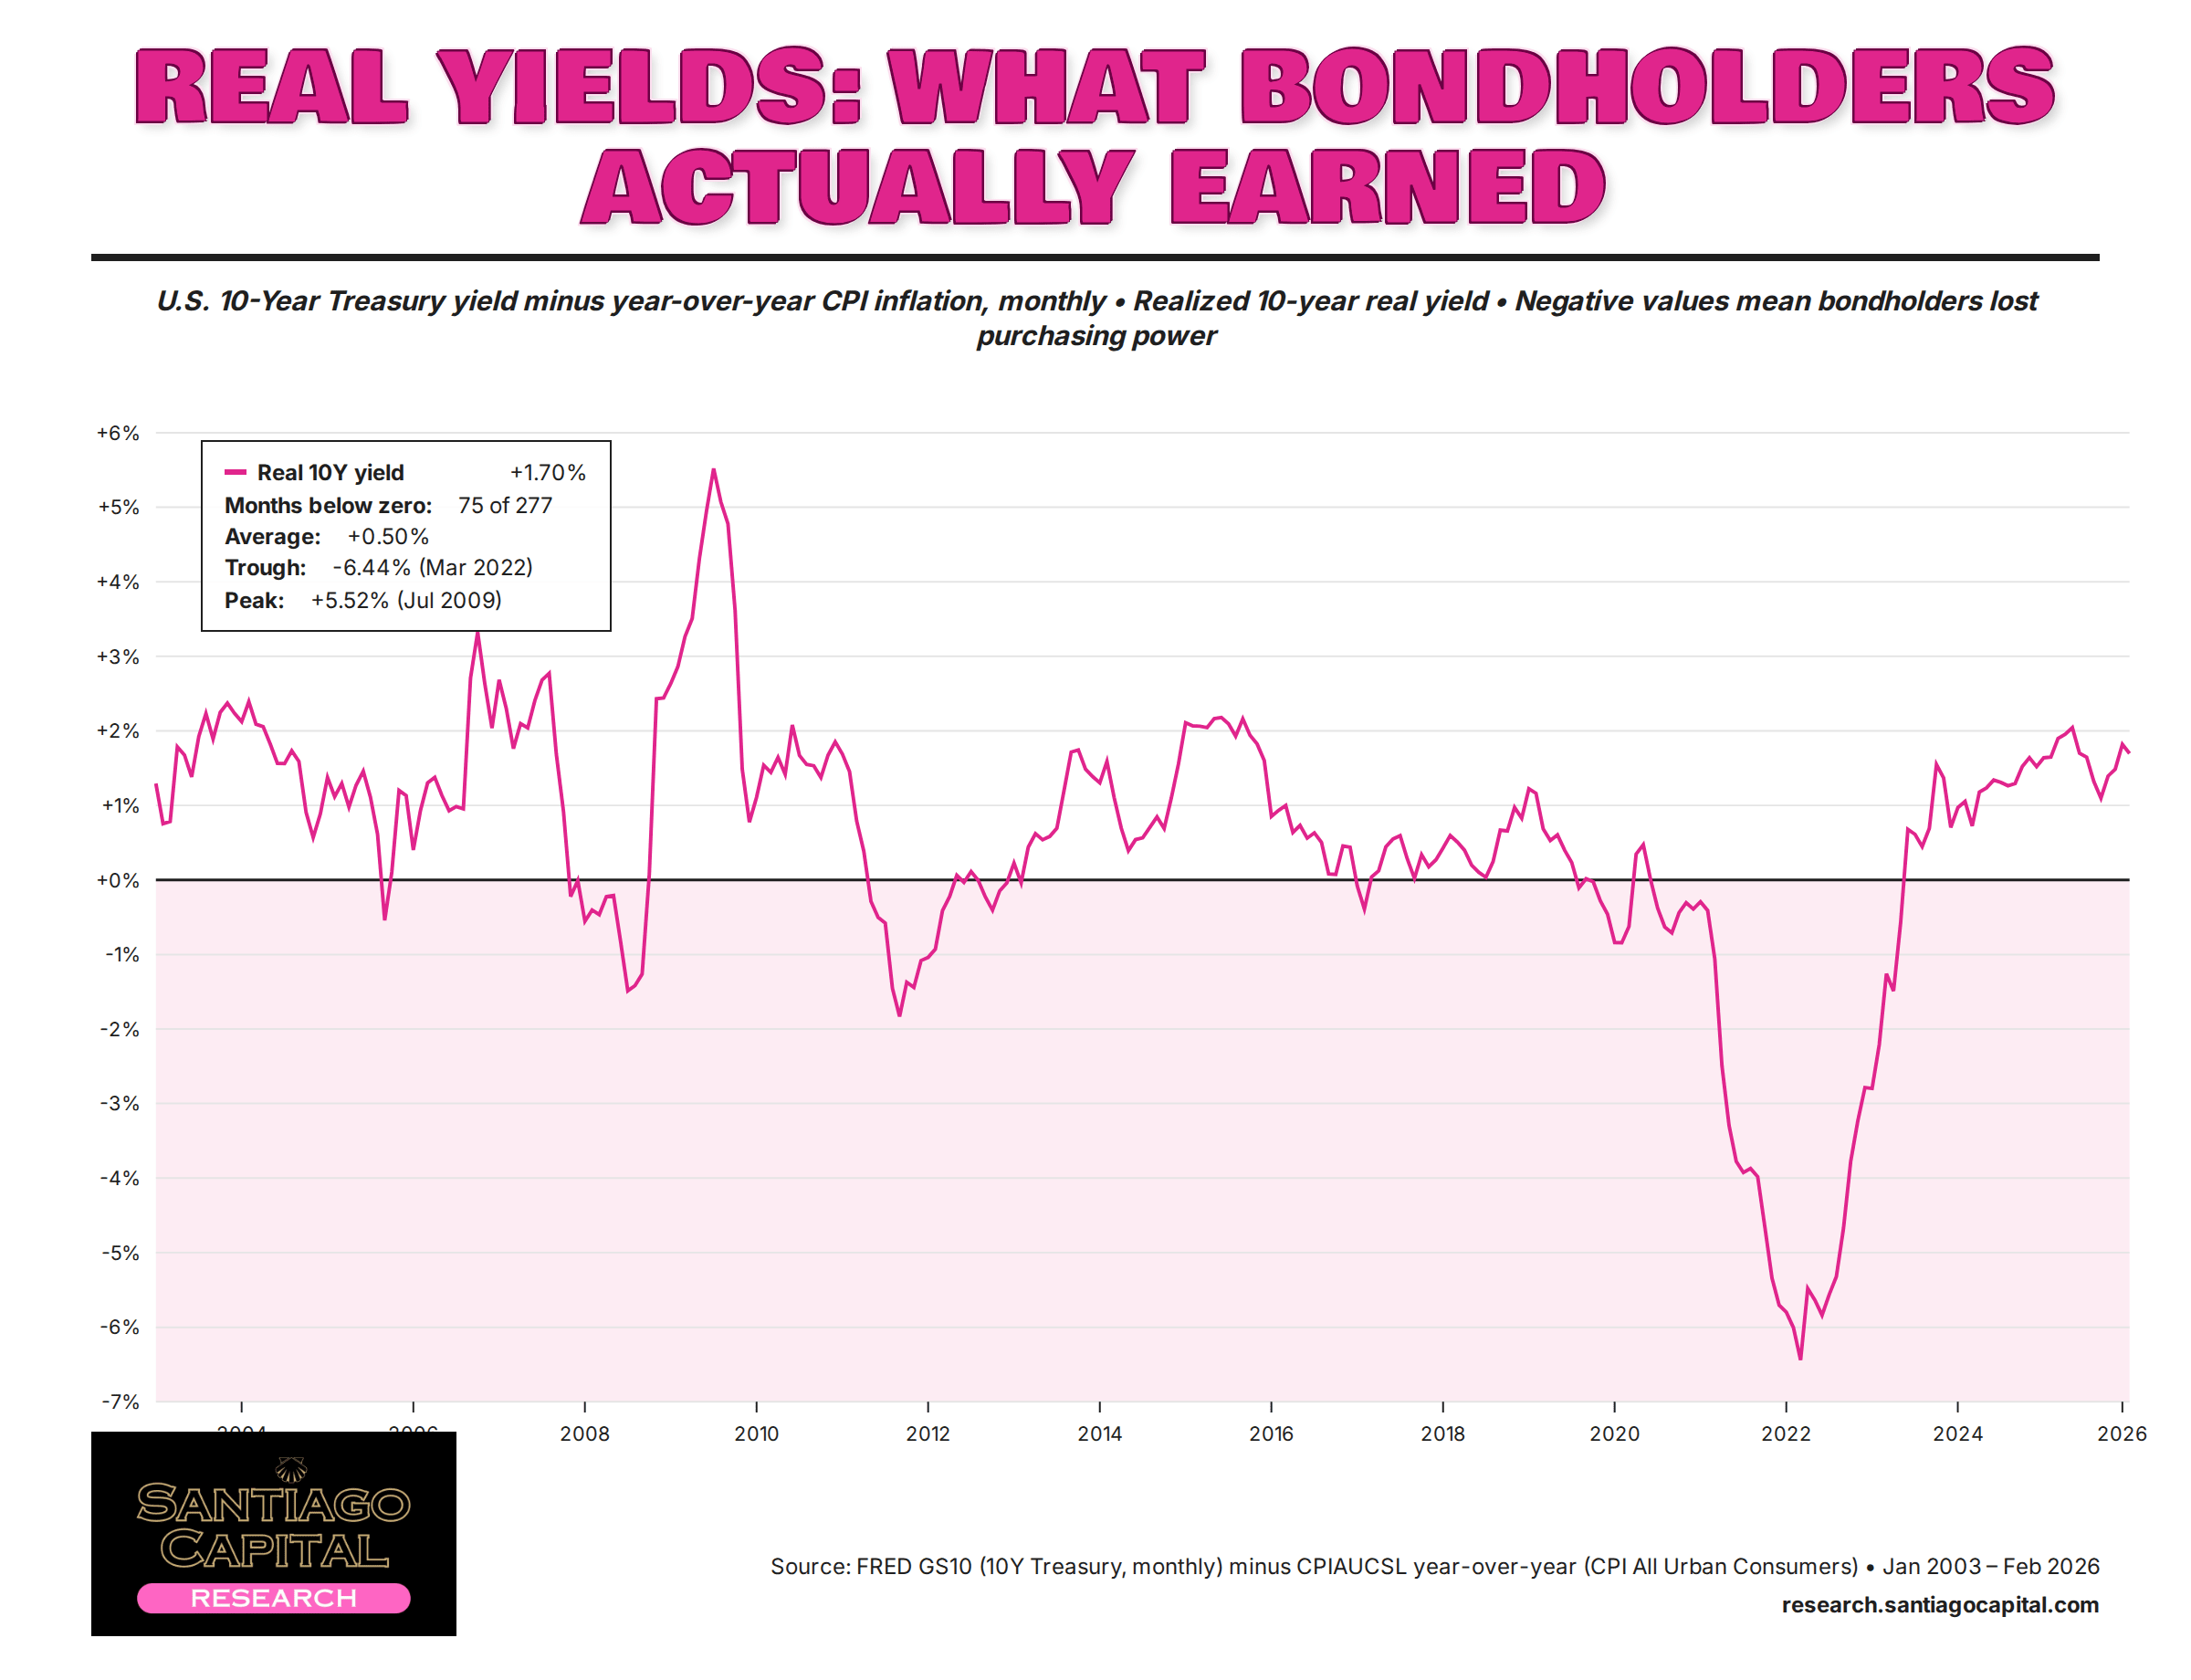
You don’t have to believe in any specific monetary regime to see that the conditions which made the 60/40 work are no longer the conditions you are investing inside. The framework that produced negative stock-bond correlation is the same framework that produced positive real yields, contained inflation, and a Fed that could be counted on to cut into a stock-market sell-off. That world ended somewhere between 2020 and 2022.
The portfolio built for the post-2017 record is operating in a regime that will not deliver what it was designed to deliver. The bond sleeve is no longer doing what it was designed to do. That is not a temporary problem to wait out. It is a structural change.
The framework hasn’t changed. Most portfolios just haven’t caught up.
The shift in stock-bond correlation is one specific instance of a much larger pattern. The negative-real-yield environment, the structural inflation regime, the Fed’s constraint between fiscal dominance and price stability... these are the conditions this publication has been mapping for the last eighteen months.
If the framework above resonates, Premium gives you the weekly continuation. The Sunday Macro Pilgrim’s Ledger reads each new data print, FOMC move, and central-bank cross-current against the framework you’ve just finished. The full Premium archive carries the prior pieces this article extends, including this week’s The Saver’s Tax, which maps the same mechanism from the cash-saver’s side.
The work is the work.
→ Upgrade to Premium:
Santiago Capital is a registered investment advisor. The content above is for informational and educational purposes only. It is not investment advice, a recommendation, or a solicitation to buy or sell any security. Past performance is not indicative of future results. Consult your own financial advisor before making investment decisions.