


"In theory, there is no difference between theory and practice. In practice, there is." — Yogi Berra
Markets speak in rhythm. Right now, that rhythm is off.
After a brutal early-April sell-off, global markets staged a synchronized bounce.
Stocks, commodities, and currencies all rallied. Headlines declare the worst may be over. But beneath the surface, something feels wrong.
We’ve seen this before. This pattern of rallying on hope, not fundamentals, tends to end the same way: with another leg down.
Charts tell the story. And they’re starting to whisper again.

One Bounce, Many Warnings
The recovery across major indices has been impressive in scale, if not in substance.
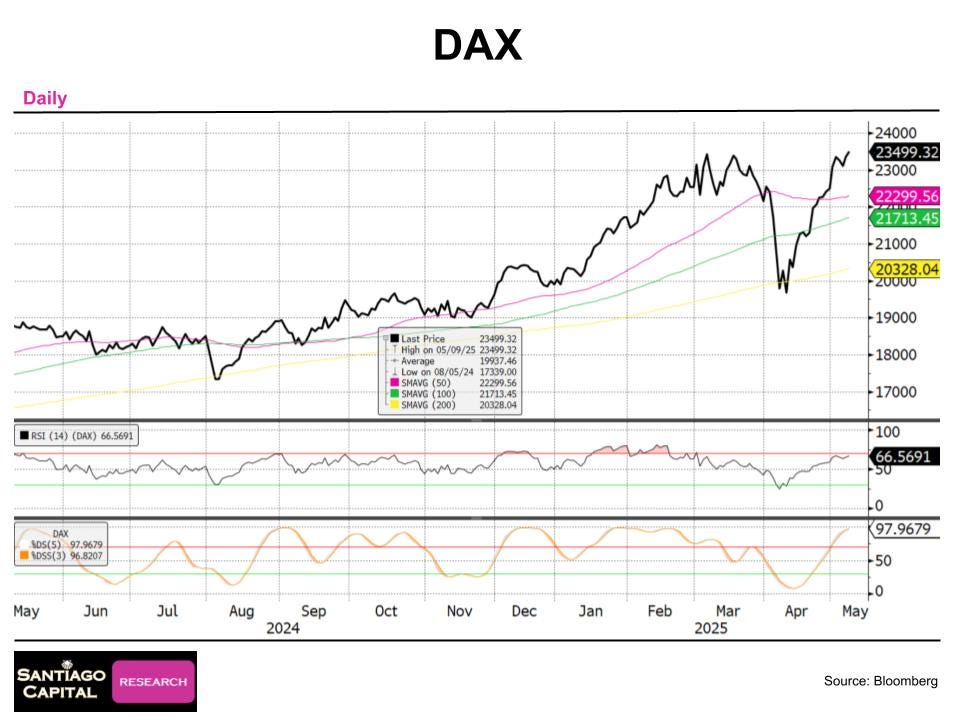
The Dow, S&P 500, NASDAQ, and Russell 2000 all caught a bid. So did the DAX, Eurostoxx, Nikkei, and Shanghai Composite. Some, like the DAX, even made new all-time highs. Risk-on is back, apparently.
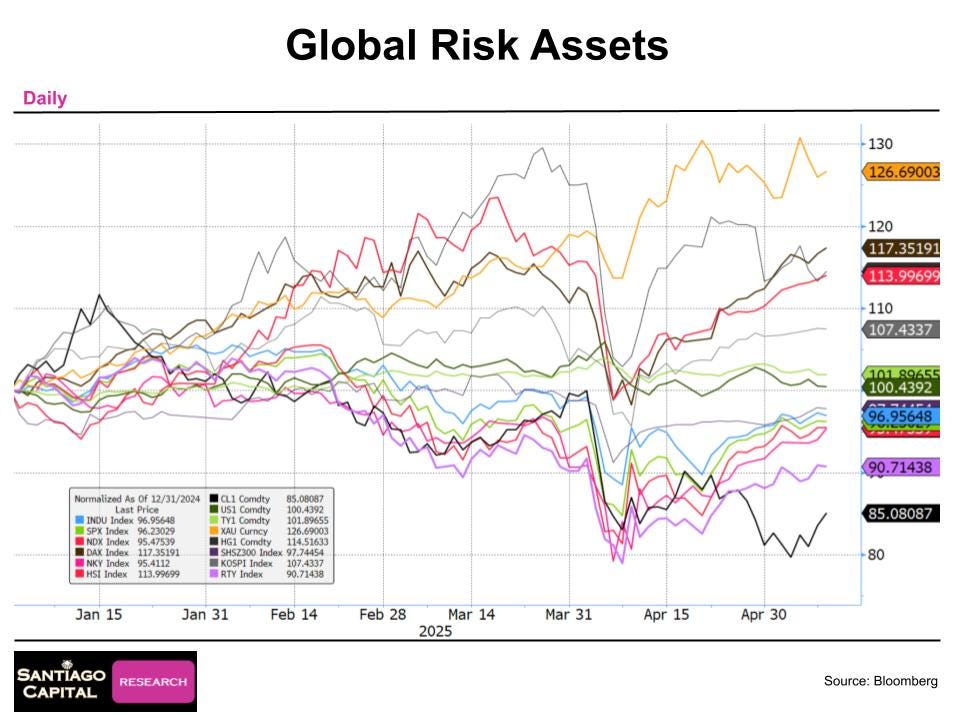
But it’s all moving together.
Synchronized moves are great when things are rising. But they’re dangerous when things reverse. In 2022, we saw markets across the globe fall in tandem. The risk now is similar.
Let’s start with the Dow. It broke above its 50-day moving average. Good.
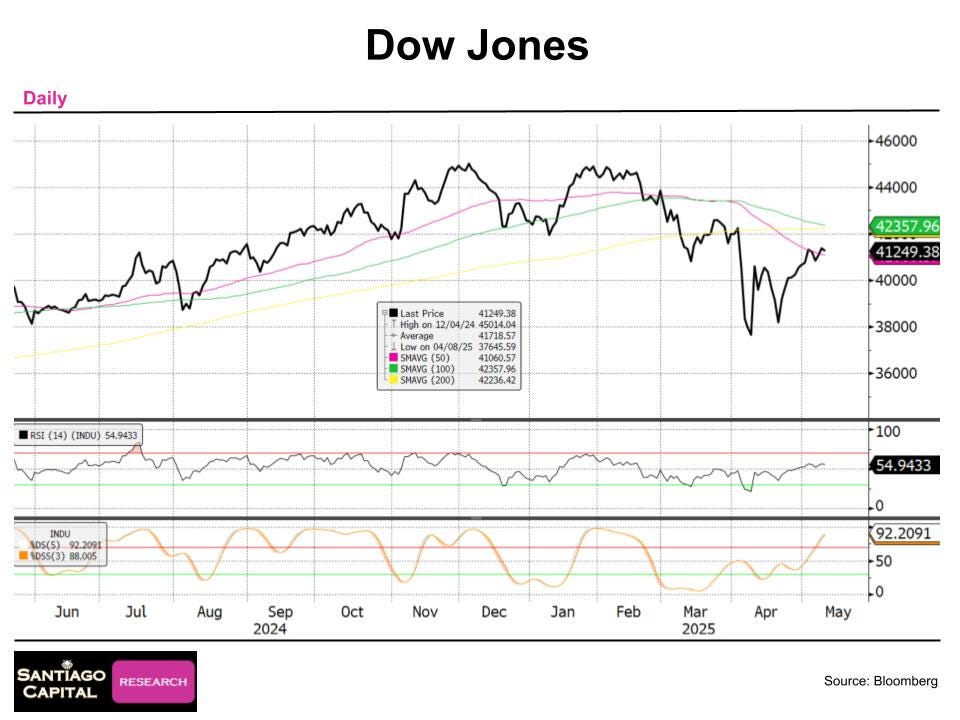
But the 100-day is on the verge of crossing below the 200-day. That’s a longer-term bearish signal…a slow-motion warning.
Same setup in the S&P 500 and NASDAQ. And stochastics (measuring momentum) are in the low-to-mid 90s.
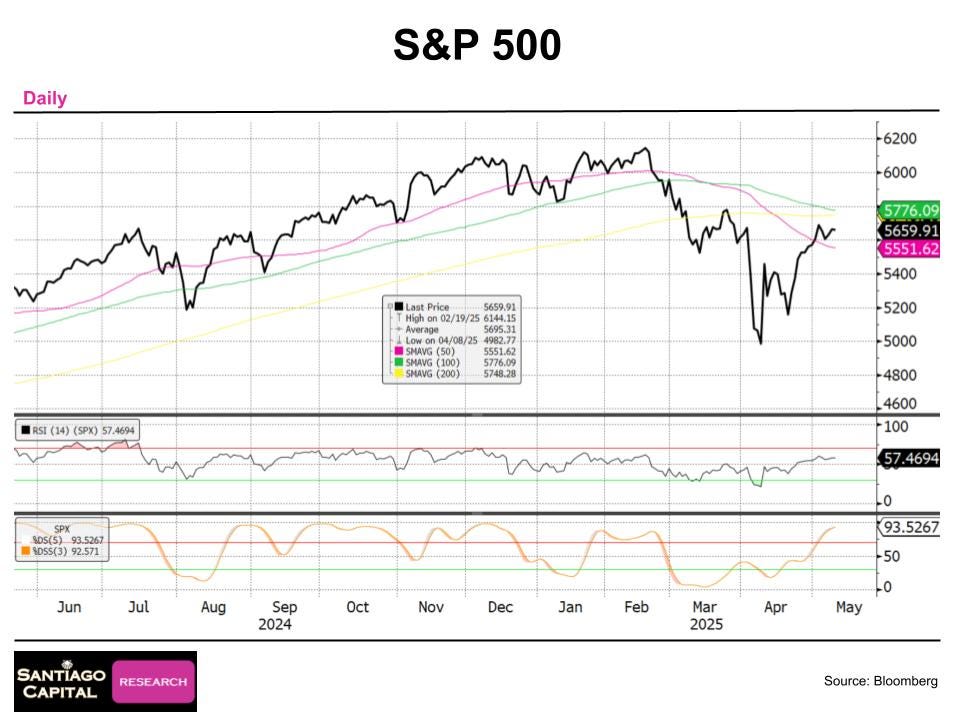
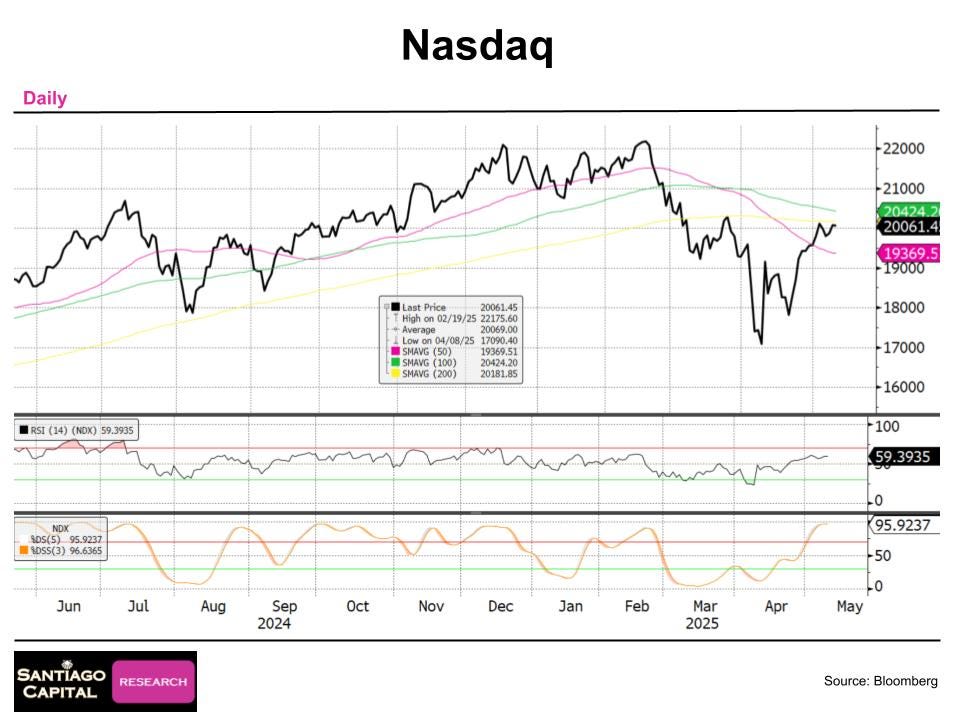
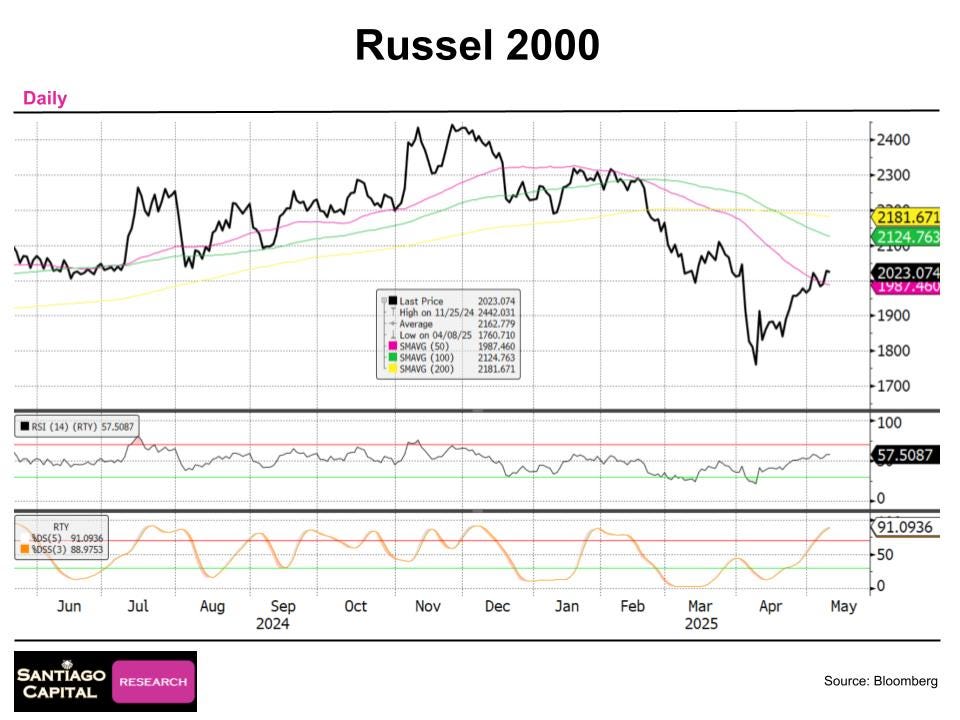
Momentum is peaking. The Russell 2000 has already confirmed the 100/200-day bearish crossover.
International markets? Similar picture. The DAX is at all-time highs, but stochastics are at 98. Momentum can’t get much higher.
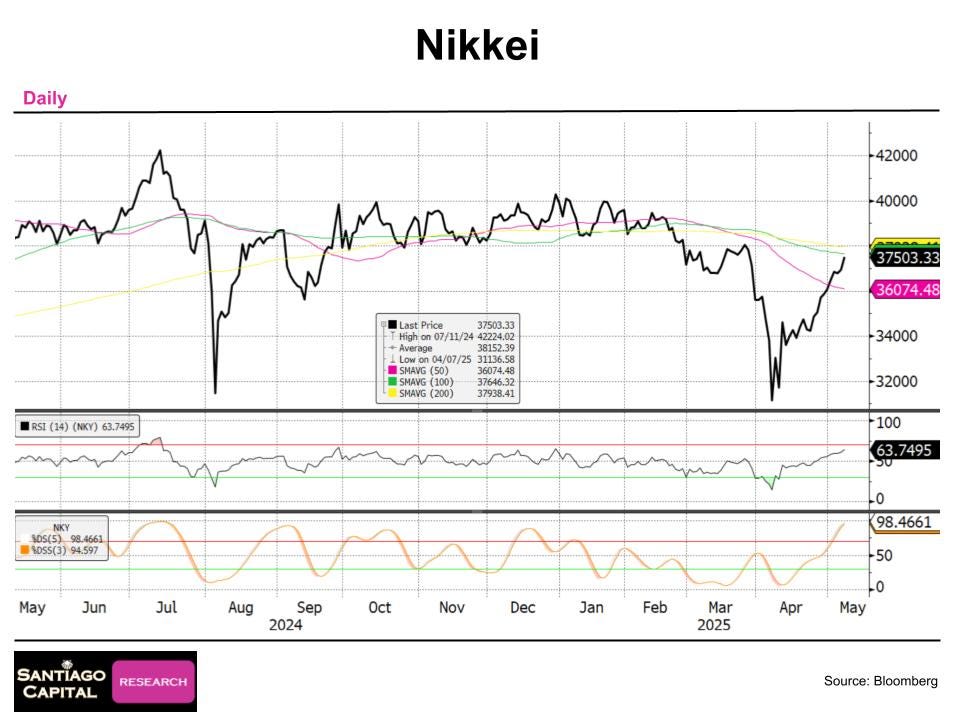
The Nikkei has bounced 15–20% off the lows but now bumps into both the 50-day and 200-day MAs…stochastics, again, at 98.
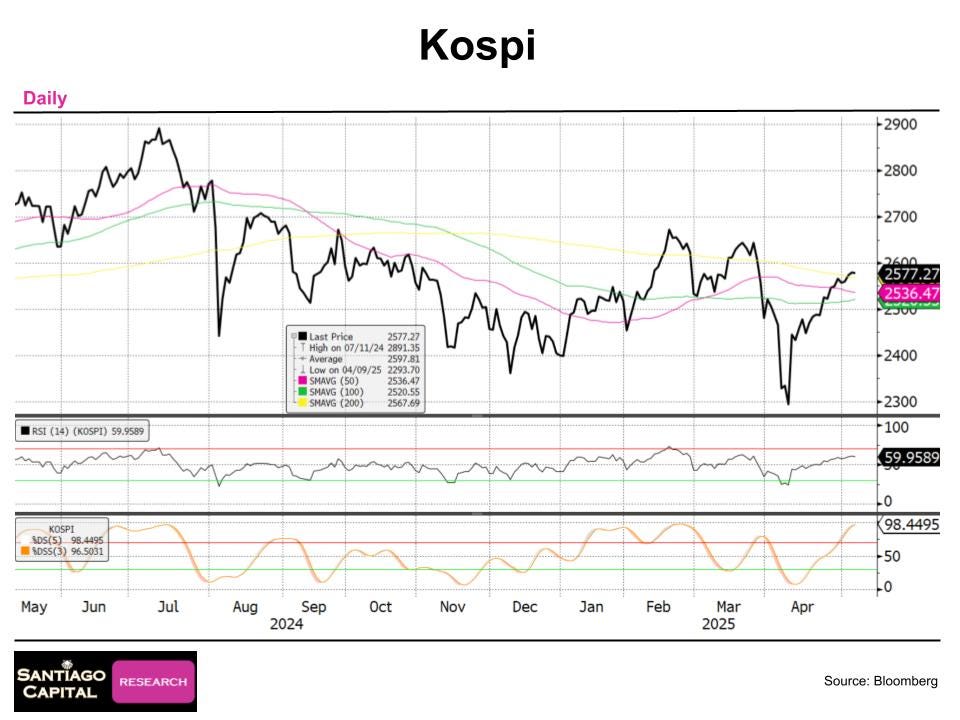
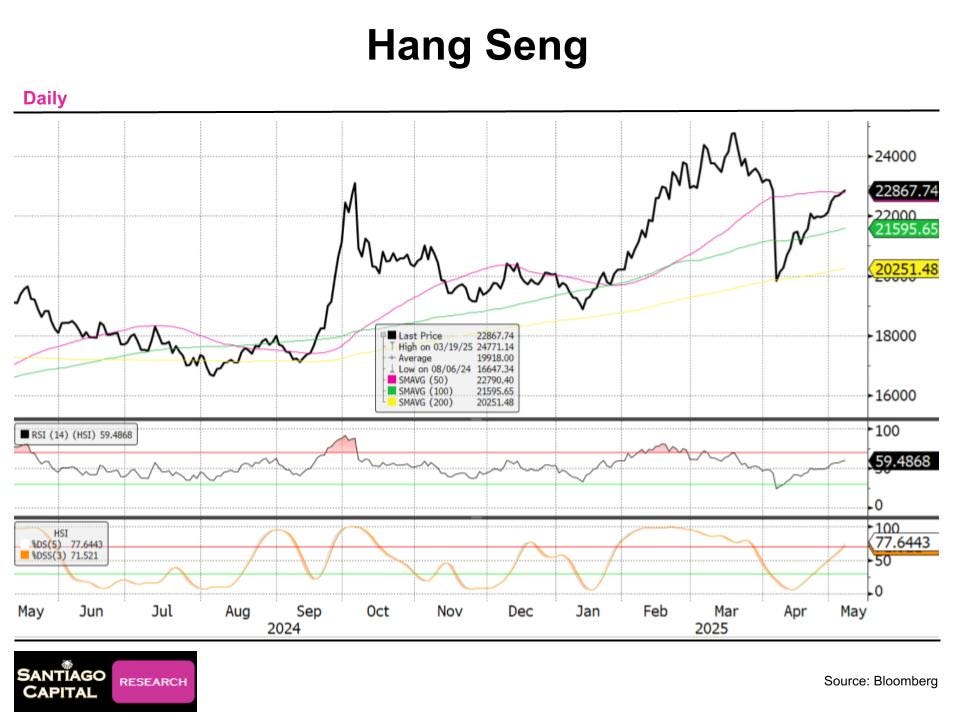
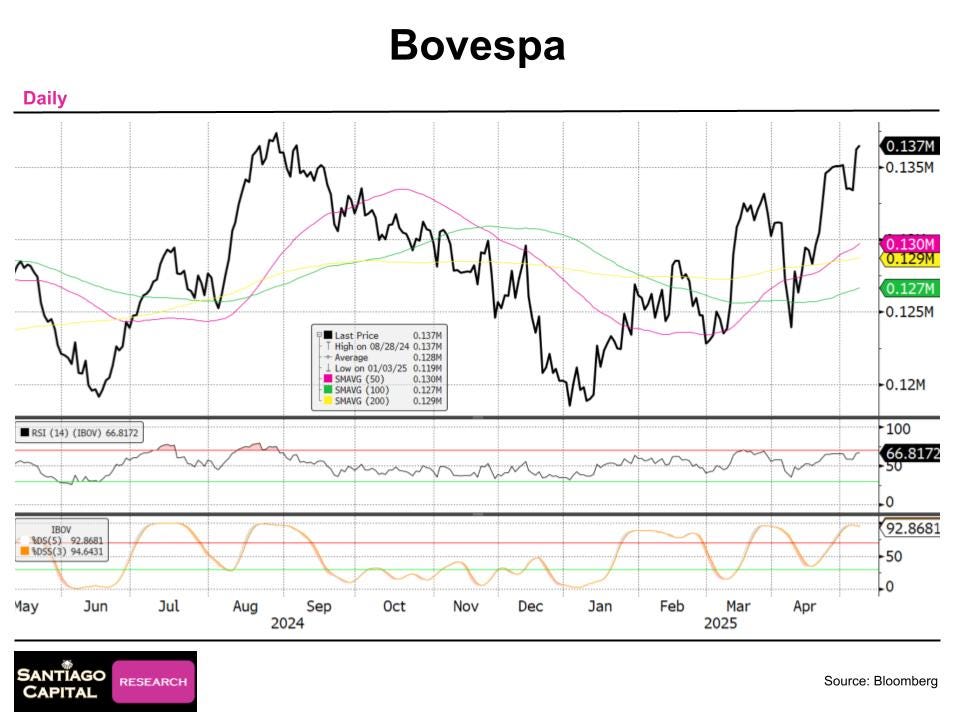
Korea, Hong Kong, and Brazil? High stochastics. RSI in neutral. Bounce fading.
This does not look like a setup for another leg higher. It’s looks like a setup for near term exhaustion.

Commodities Are Not Convinced
If global growth were accelerating, commodities would be leading. They’re not.
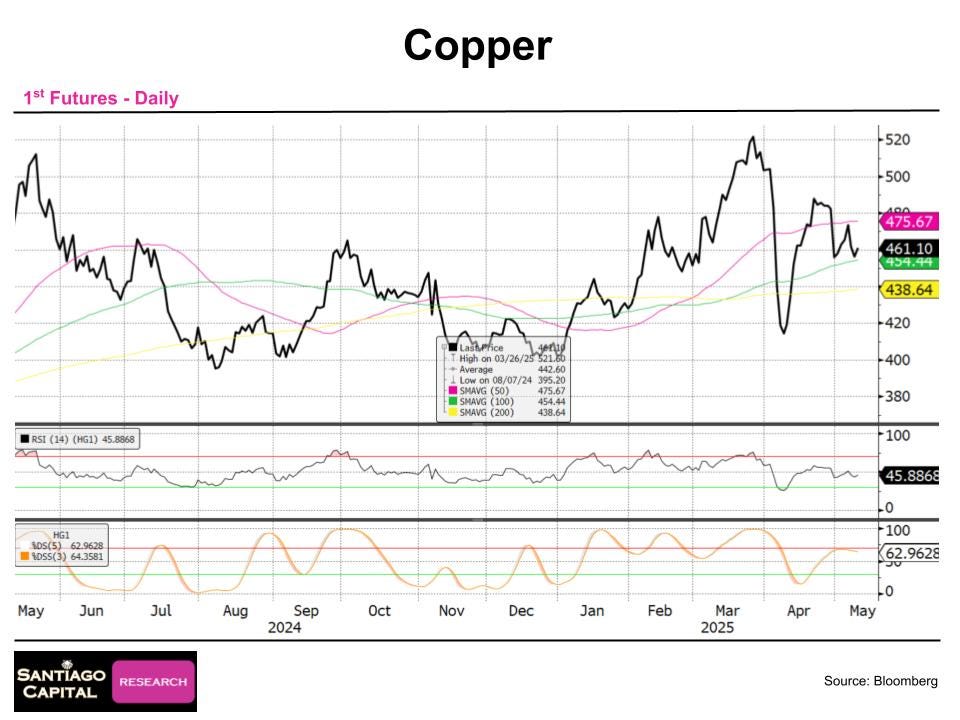
Copper. It bounced off the lows but never reached overbought territory. Now it's already rolling over. The doctor doesn’t like what it sees.
Oil dropped to $57–58, then bounced to just above $60. No conviction. Stochastics are low. RSI is neutral.
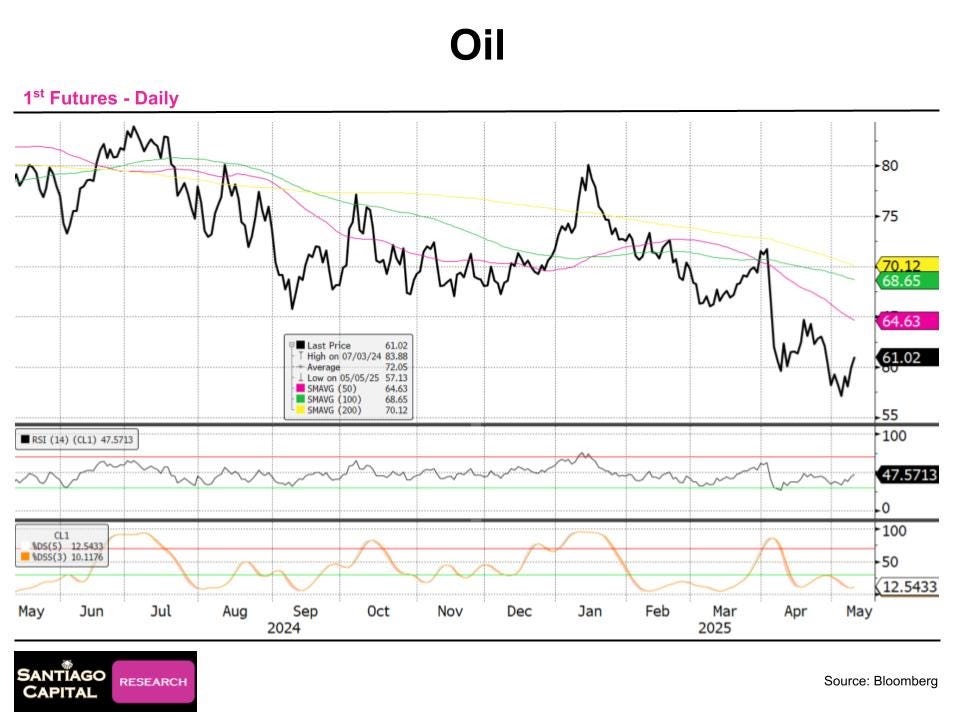
This isn’t a healthy uptrend. In a real economic expansion, oil wouldn’t be this lazy.
So either the economy isn’t growing, or something else is holding prices down. Neither option is bullish.

The Currency Clue: Taiwan Dollar Cracks
The biggest alarm bell is ringing in FX.
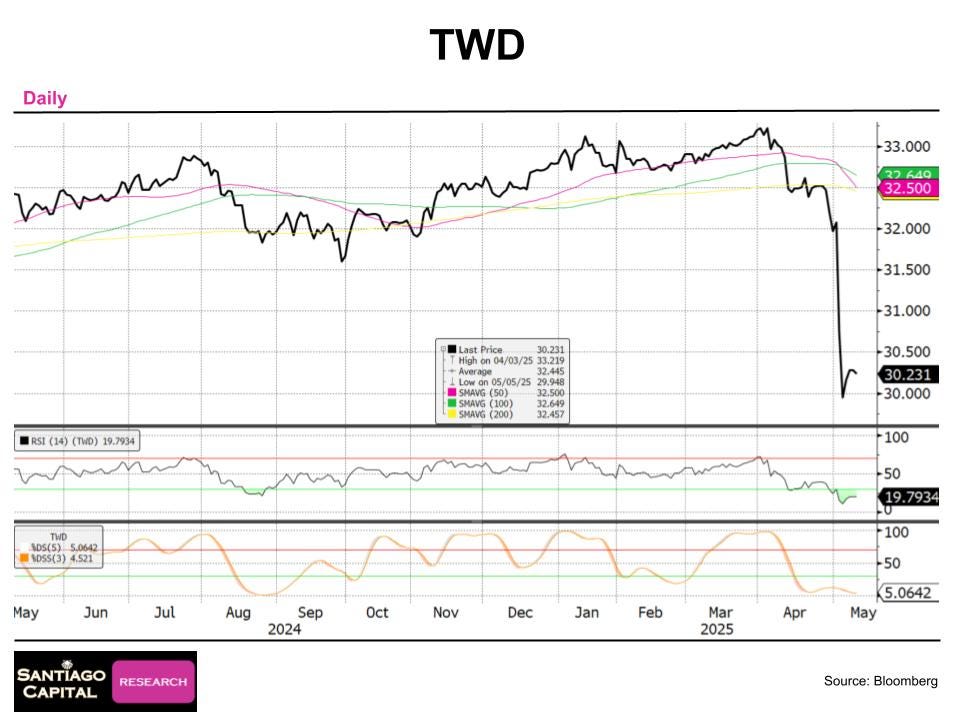
The Taiwan dollar just had a 9–10% move. Its biggest move in over 40 years. That doesn’t happen without something breaking. This wasn’t speculation. This was forced activity.
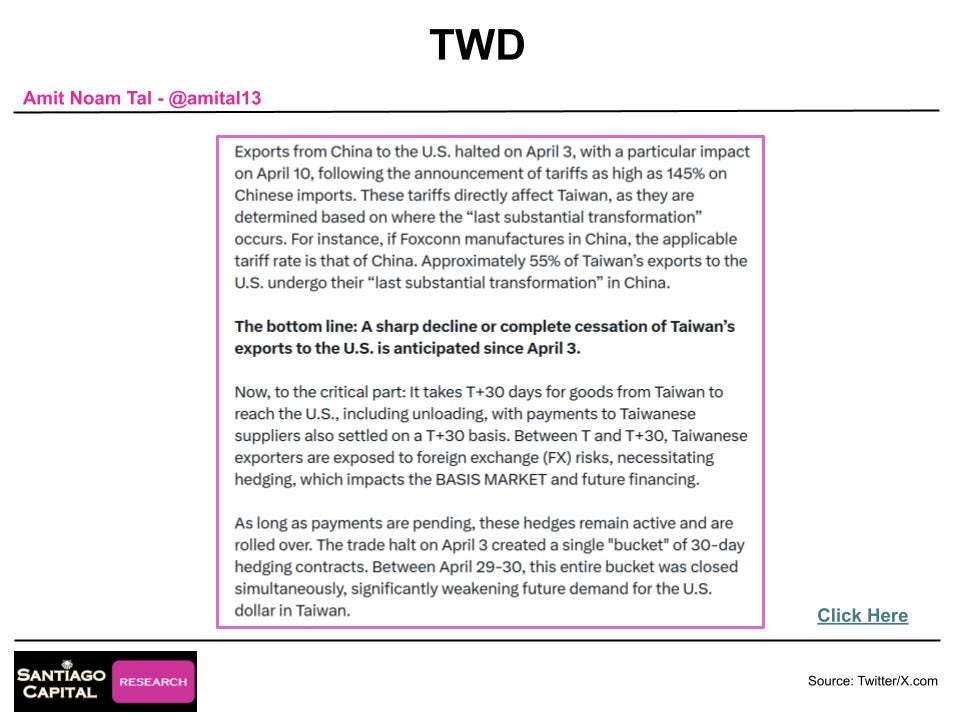
The cause? U.S. tariffs on Chinese exports. Some up to 145%. Taiwan is tightly integrated into those supply chains.
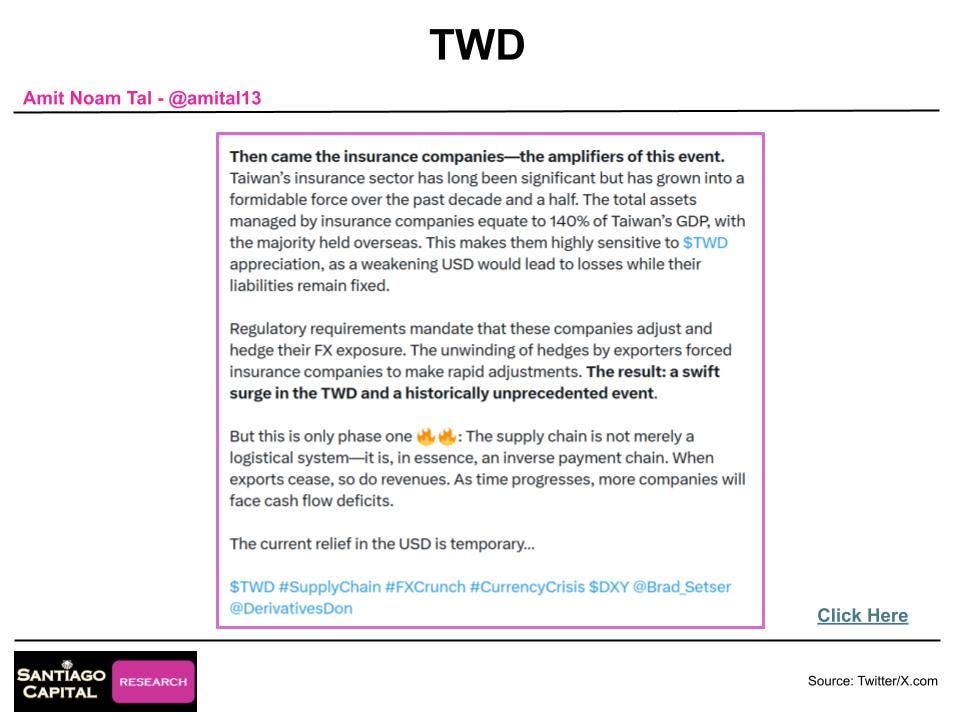
Taiwanese exporters and insurers suddenly needed to unwind massive hedges. All at the same time.
The result: a surge in TWD demand, and a shock rise in the Taiwan dollar. (in the chart above, a falling chart means the TWD rising vs the USD).
RSI on the Taiwan dollar dropped to 9. Stochastics hit 4 or 5. This is extreme overbought (reminder, the chart is reversed, up is weakness and down is strength). More than just technicals, this is a sign of structural stress.
These are not ordinary market movements. This is stress showing up in real time.
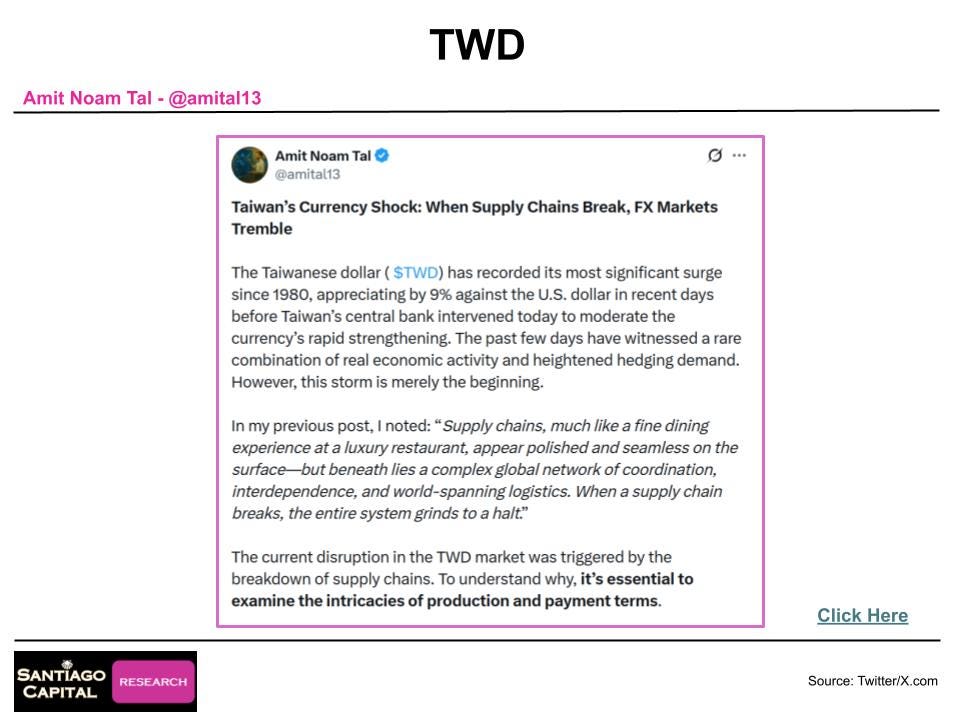
The reason for the move? Amit Noam Tal explained perfectly on Twitter/X and we highlight it below. The important take away? The current relief in the USD is temporary…
Click Here to read it directly
Dollar Pressure Is Building
The U.S. dollar index (DXY) has been weak. RSI has bounced from extremely oversold and now sits in no mans land. Stochastics recently got as low as 1 or 2 but have also bounced. But the fact that it got that oversold, and is still hanging out around the 100 level is not a great sign for the rest of the world.
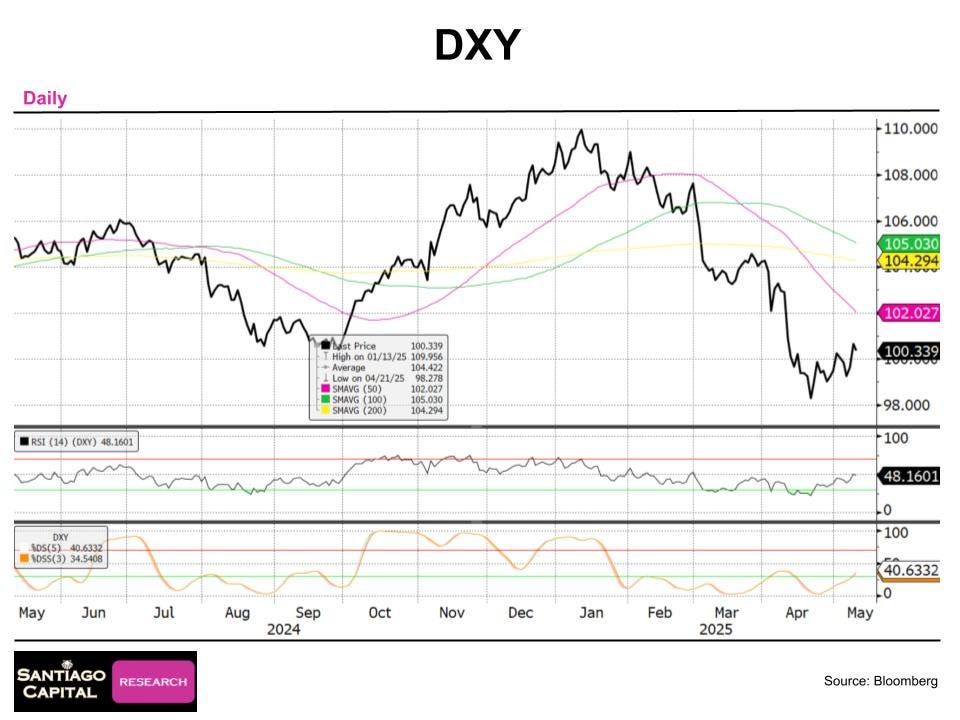
It could actually be a problem.
When something gets that oversold, just as we saw in the risk assets above, a move lower is unlikely. Which means it might be about to rise. And a rising dollar is usually bad for everything else.
Other currencies are stretched. The euro, yen, and pound all have stochastics in the 90s and flat RSI. They look tired.
If the dollar turns up here, the unwind could be violent.
How to Position: Cautious and Hedged
This is not a time for heroism. This is a time for prudence.
Markets have rallied, but they’ve done so on weak internals. This creates an opportunity: add hedges while implied volatility is low.
The VIX is in the low 20s. That’s not panic. That’s complacency.
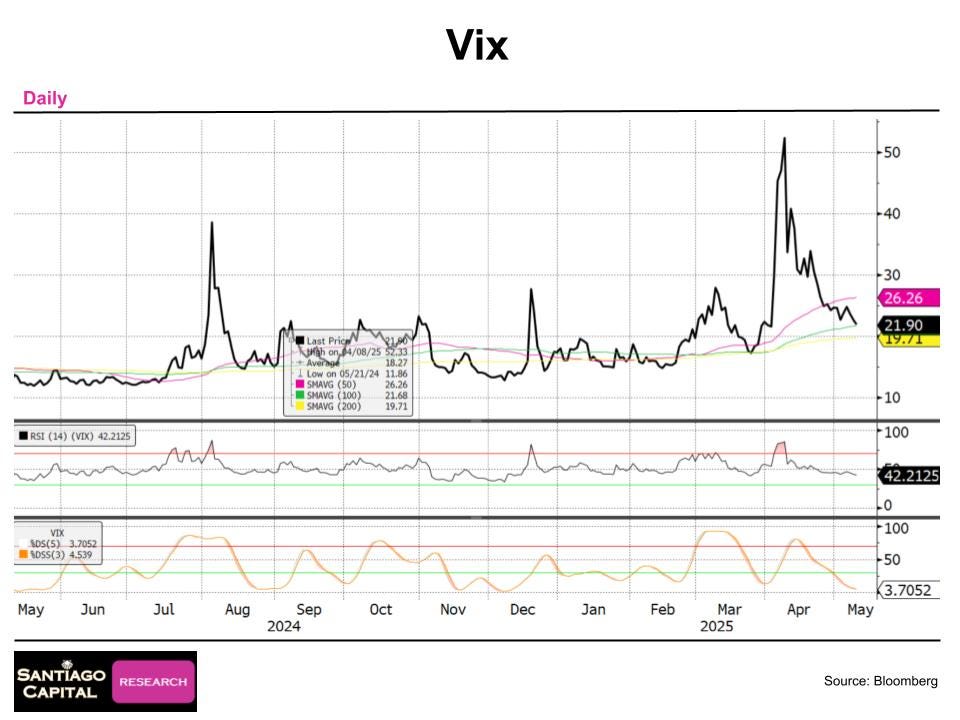
Put options are much cheaper today then they were a month ago. Especially in markets that have rallied hard, like the DAX and Eurostoxx. In my opinion that’s where protection offers the best asymmetry.
Remember, buy insurance when it’s boring. Sell insurance when it’s screaming.
If you don’t have hedges on yet, you don’t need to rush in. But it’s not a bad time to start nibbling. And then let stochastics roll over from 90+. Look for resistance tests. Use technicals.
And don’t hedge when things are already oversold. That’s what April looked like…RSI and stochastics near zero. That’s when you go long risk assets, not when you start to short them.
Timing matters.
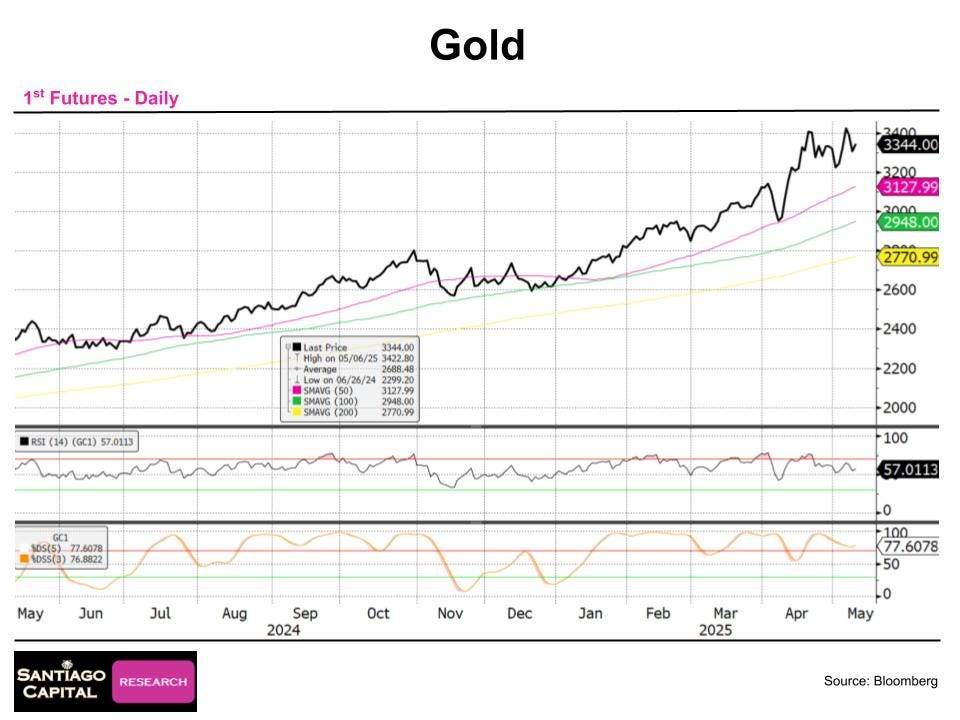
Gold, Currencies, and the Crosswinds
Gold has been steady. It’s still leading YD, but it’s not currently breaking higher. RSI is neutral. Stochastics are mid-range. It’s a hold for now.
Commodities tied to real demand (like copper and oil) are fading. Watch for further breakdowns there.
Currency markets are flashing warnings. Especially those linked to trade and supply chains: Taiwan, Singapore, Korea.
The Taiwan dollar’s recent move could be a preview. If supply chains remain broken…or if tariffs escalate… the stress could spread.
Technical Levels to Watch
The clearest reversal signals come from a few key indicators:
Bearish 100/200-day moving average crossovers. Confirmed in the Russell 2000. Close in the Dow, S&P 500, and Nikkei.
Stochastics above 90 that begin to roll over. This is the canary.
RSI approaching extremes (above 70 or below 30). Right now, most indices are in "no man's land" (mid-50s to 70).
Sentiment: the S&P 500’s sentiment gauge is at 70. Neutral, but close to caution territory.
And then there’s volatility.
The VIX is oddly calm. Stochastics at 3. No fear. Yet.
That doesn’t last forever.
Watching June
Timing these moves is hard. But patterns matter.
The structure suggests a peak and reversal in early June. That’s when the charts suggest momentum could roll.
If that happens, we could see another 2022-style drawdown… 25% peak-to-trough. Not guaranteed. But the setup is there.
Momentum is peaking. Correlations are high. Sentiment is complacent.
This is how breaks happen.

Conclusion: Don’t Get Comfortable
Markets are calm. But they don’t feel stable.
When everything moves up together, everything can fall together.
This isn’t about panic. It’s about preparation.
The technicals are setting up. The macro crosscurrents are in play. The dollar is oversold. Commodities are weakening. Supply chains are stressed.
It might all hold. But if it doesn’t, it won’t give much warning.
Stay cautious. Stay hedged. Stay alert.
The rhythm is off. And when the beat drops, it’s usually too late to move.
🔴 The Founders didn’t try to tame greed...they built the republic around it. Could that brutal logic be the secret to America’s survival?
