A Macro Pilgrim's Ledger - The Santiago Way (9/7/25)
Your weekly review by Santiago Capital
Cut through the noise. Brent Johnson’s A Macro Pilgrim’s Ledger— is a weekly briefing that tells you what last week meant and what’s next.
This weeks report is complimentary.
The first full week of September delivered a jolt.
A labor market that had stood as the cornerstone of U.S. resilience finally cracked, and the numbers were impossible to dismiss.
Payroll growth barely registered, the unemployment rate climbed, and for the first time in years job seekers outnumbered job openings.
It was not a subtle shift or a technical miss. It was the kind of report that forces a reckoning.
Markets are built to handle strength and they are prepared to handle weakness. What unsettles them most is when the foundations themselves start to move.
For months, investors could lean on the certainty that jobs would hold, even if manufacturing faltered or inflation wavered.
That certainty is gone.
Every datapoint now carries more weight because the cushion beneath them has thinned. The week closed with more questions than answers, leaving investors to navigate familiar terrain that suddenly feels unfamiliar.
The path has not changed, but the ground beneath it has.
The Week That Was
The calendar we set out a week ago unfolded across a shortened schedule, beginning on Tuesday, September 2, with the ISM Manufacturing PMI.
The index printed at 48.7, a sixth straight month of contraction, and only a modest improvement from July’s 48.0.
Beneath the surface, the details reinforced the drag in the sector: new orders remained weak, employment showed little lift, and backlogs continued to ease.
Rather than signaling stabilization, the report reminded investors that U.S. industrial activity remains under strain, even as broader measures of economic momentum hold up.
On Wednesday, September 3, Eurostat reported Producer Prices for July, showing a 0.4% increase month-over-month and reversing the prior month’s decline.
The rebound highlighted the persistence of cost pressures and reinforced the ECB’s difficult position: stagnant growth on one side, inflationary risks on the other.
The same day, the U.S. JOLTS survey revealed that job openings fell by 176,000 to 7.18 million, the lowest level since September 2024, and for the first time since early 2021, unemployed workers outnumbered available jobs.
Together, the releases underscored a narrowing path for policymakers in both Washington and Frankfurt. Inflation has not fully relented, yet labor demand is softening and growth momentum is increasingly fragile.
Thursday, September 4, brought the weekly U.S. jobless claims.
Initial filings rose to 237,000 from 229,000 the prior week.
The increase was not dramatic, but it fit with a gradual drift higher in claims that has been evident in recent months.
Employers continue to hold on to workers, but the slow uptick suggests the labor market is losing some of its extraordinary resilience.
For the Fed, this type of release keeps every meeting live: the data show softening and likely confirms the expectation for rate cuts.
The week closed on Friday, September 5, with the August Employment Situation Report.
Payrolls increased by just 22,000, well below expectations, while the unemployment rate ticked up to 4.3%. Job gains in healthcare were offset by losses in federal government and mining, and wage growth held steady.
The combination produced a mixed picture as labor demand is clearly slowing, but underlying price pressures tied to wages remain.
For markets, the report offered no clean resolution.
Instead, it reinforced the sense that policy remains caught between disinflationary progress and the risk of easing too soon.
Every bullet highlighted in last week’s Week Ahead played out in sequence, but the week’s events delivered more questions than answers.
Manufacturing weakness deepened, European cost pressures re-emerged, jobless claims edged higher, and payroll growth slowed.
Yet none of these outcomes were definitive enough to force a break in policy or market conviction.
The result was a week that confirmed the themes already in play: in the post–Jackson Hole environment, no datapoint can be dismissed, and every release lands with amplified weight.
Macro / Policy
The week’s data forced policymakers into sharper relief.
In the United States, the weak August payrolls print, just 22,000 new jobs and a higher unemployment rate of 4.3%, shifted the conversation squarely onto the Fed.
Futures markets moved to price in not only a September rate cut, but also the real possibility that the first move could be larger than a quarter point.
Fed officials did not confirm that outcome, but their public remarks kept every option alive.
Governor Waller noted that labor “no longer looks unbreakable,” while New York Fed President Williams emphasized that upcoming meetings remain “fully data dependent.”
Together, the signals confirmed what markets have already internalized: the Fed is no longer debating whether to cut, but how fast and by how much.
Across the Atlantic, the ECB entered September boxed in by the very forces Eurostat highlighted midweek.
Producer prices rose 0.4% in July, reversing the prior month’s drop and reminding policymakers that pipeline inflation remains. Yet growth across the bloc shows no acceleration.
Officials leaned on familiar language, stressing vigilance but offering little in the way of guidance.
The balance remains precarious: the cost of easing is potential currency instability, the cost of holding steady is a deeper slowdown.
Frankfurt’s silence was telling as it can do little more than wait for Washington to move first.
In Japan, the BOJ stayed conspicuously quiet as global yields adjusted to softer U.S. labor data. Each passing week adds to the cost of defending its yield-curve regime, but the bank’s determination to maintain policy settings remains undiminished.
For investors, the silence is its own signal: Tokyo is not ready to shift course, regardless of pressure from abroad.
Taken together, the week confirmed a divergence in policy outlooks. The Fed is preparing to ease, the ECB is cornered by conflicting signals, and the BOJ is holding the line despite mounting costs.
For markets, this is the environment Jackson Hole foreshadowed but did not resolve: a world where every release matters, and where the rules for interpreting them are still being rewritten in real time.
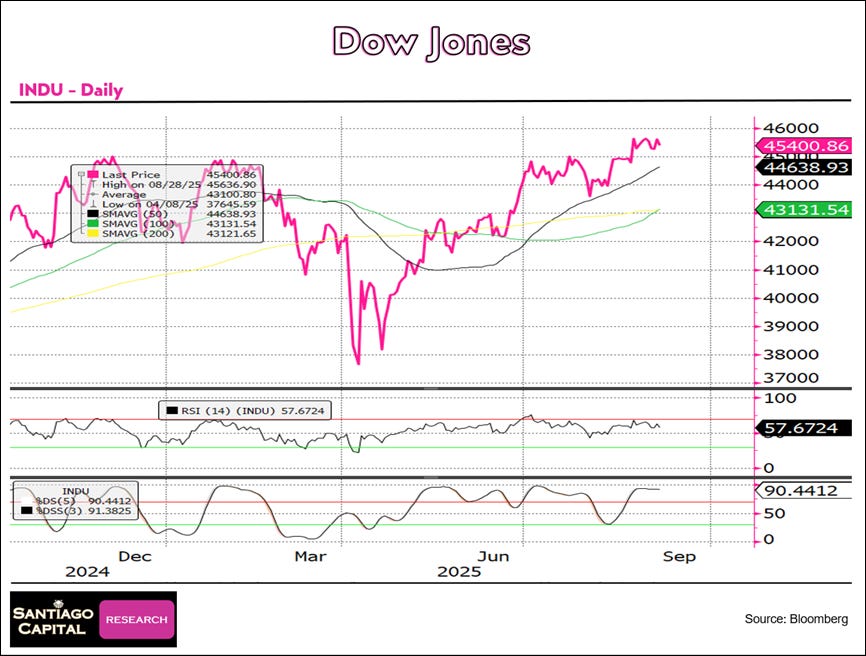
Dow Jones (INDU – Daily)
Price at 45,400.86, extended above all major moving averages.
RSI at 57.67, neutral and flat.
Stochastics at 90.44 / 91.38, firmly overbought and flat.
Trend remains strong but stretched and looks tired.
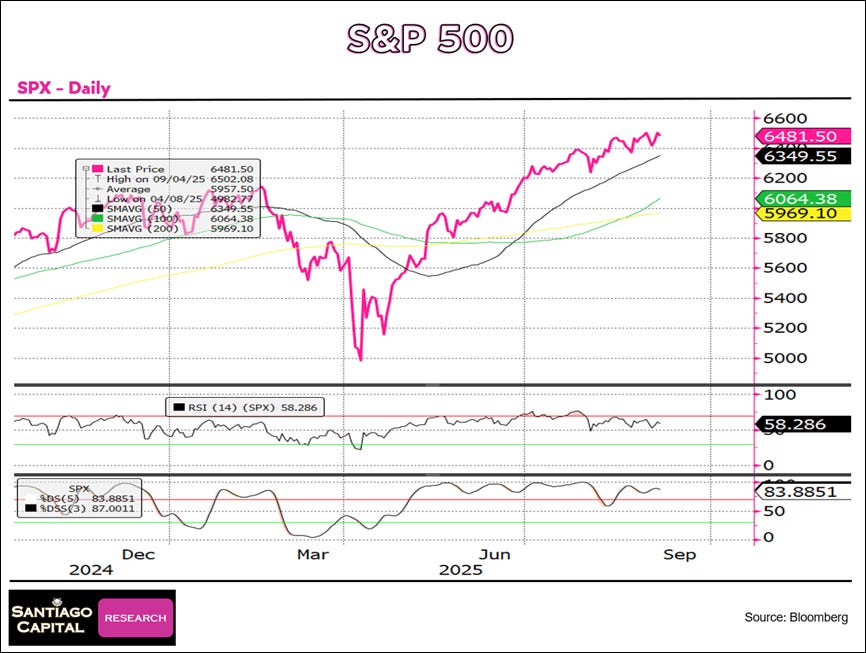
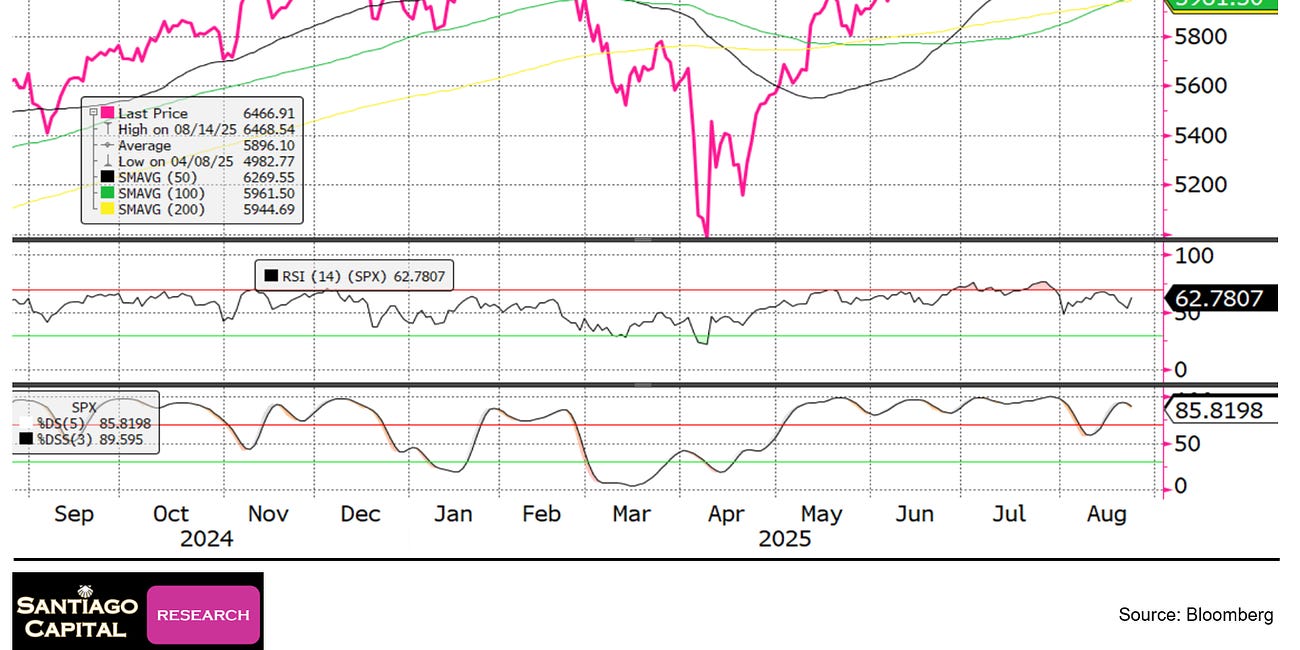
S&P 500 (SPX – Daily)
Price at 6,481.50, extended above all major moving averages.
RSI at 58.29, neutral and flat.
Stochastics at 83.89 / 87.00, overbought and rising.
Trend remains strong but stretched.
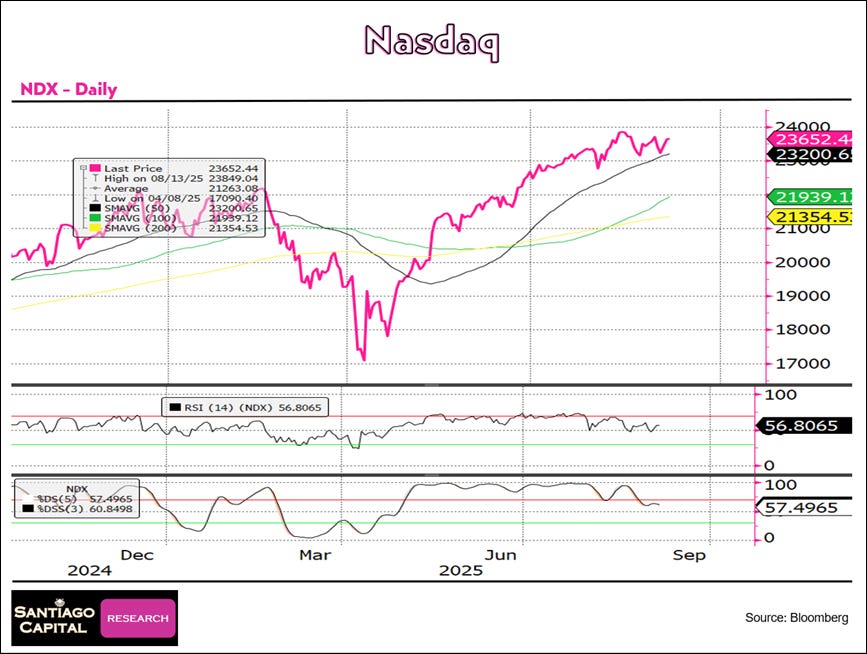
Nasdaq 100 (NDX – Daily)
Price at 23,652.44, holding above all major moving averages.
RSI at 56.81, neutral and flat.
Stochastics at 57.50 / 60.85, neutral and flat.
Trend looks tired and is consolidating.
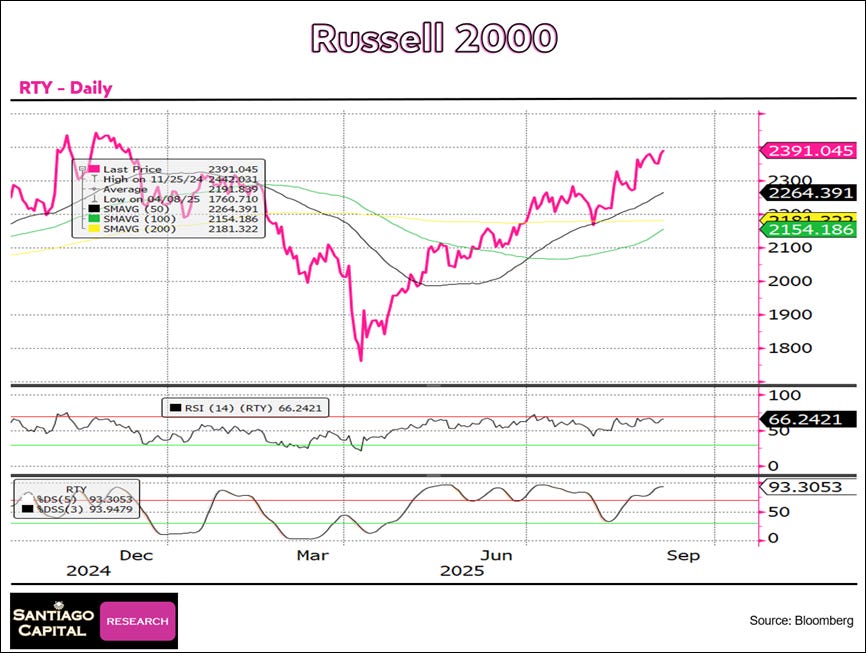
Russell 2000 (RTY – Daily)
Price at 2,391.05, extended above all major moving averages.
RSI at 66.24, near overbought and rising.
Stochastics at 93.31 / 93.95, firmly overbought and rising.
Trend remains strong but stretched.
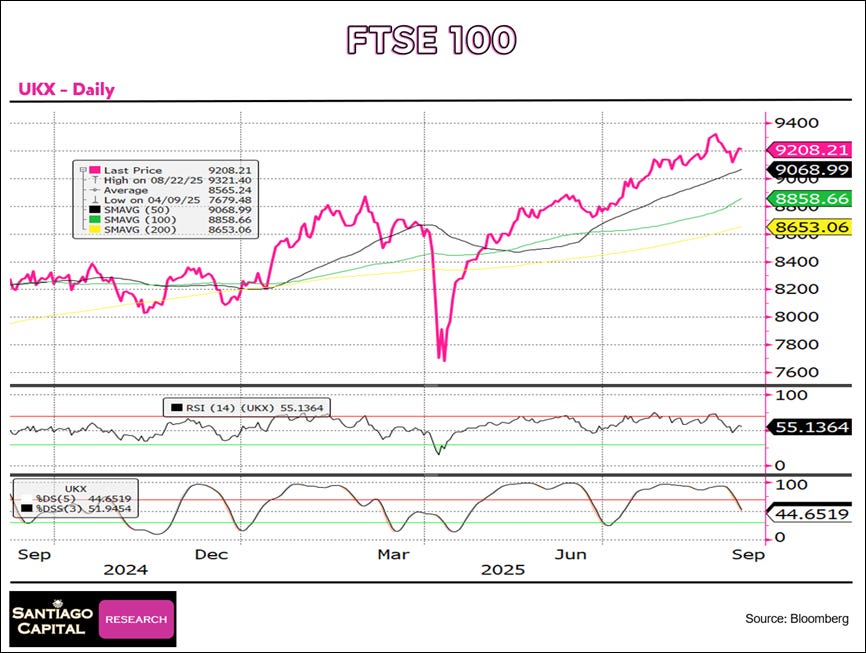
FTSE 100 (UKX – Daily)
Price at 9,208.21, holding above all major moving averages.
RSI at 55.14, neutral and falling.
Stochastics at 44.65 / 51.95, neutral and falling.
Trend consolidating.
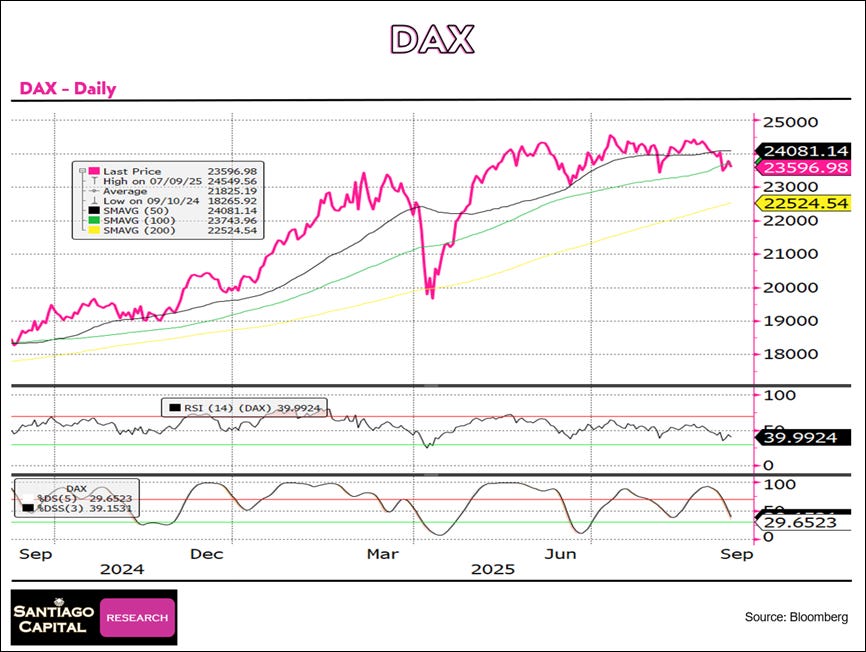
DAX (Germany – Daily)
Price at 23,596.98, below the 50DMA but above the 100DMA and 200DMA.
RSI at 39.99, near oversold and falling.
Stochastics at 29.65 / 39.15, oversold and falling.
Trend weakening.
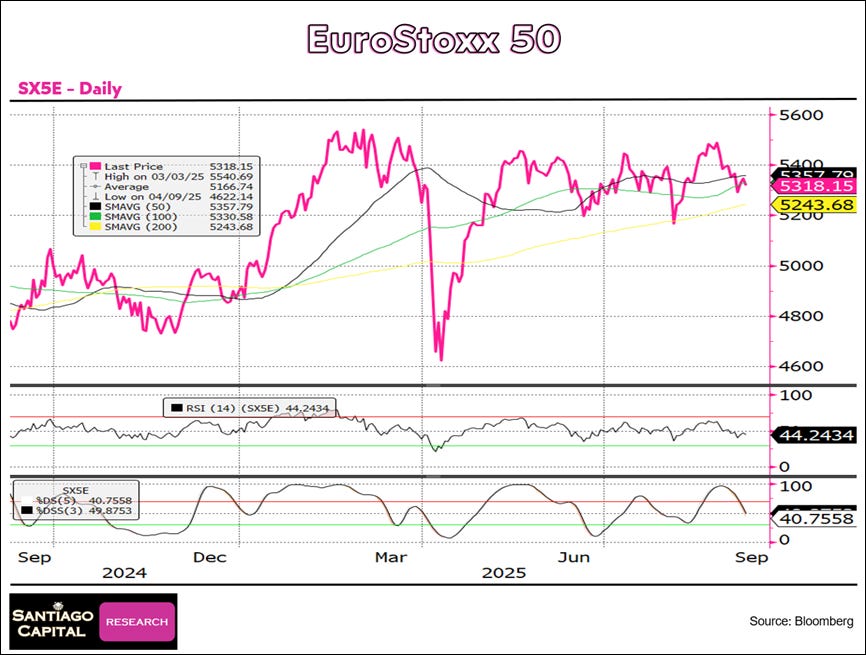
EuroStoxx 50 (SX5E – Daily)
Price at 5,318.15, testing the 50DMA and just above the 200DMA.
RSI at 44.24, neutral and falling.
Stochastics at 40.76 / 49.88, neutral and falling.
Trend indecisive.
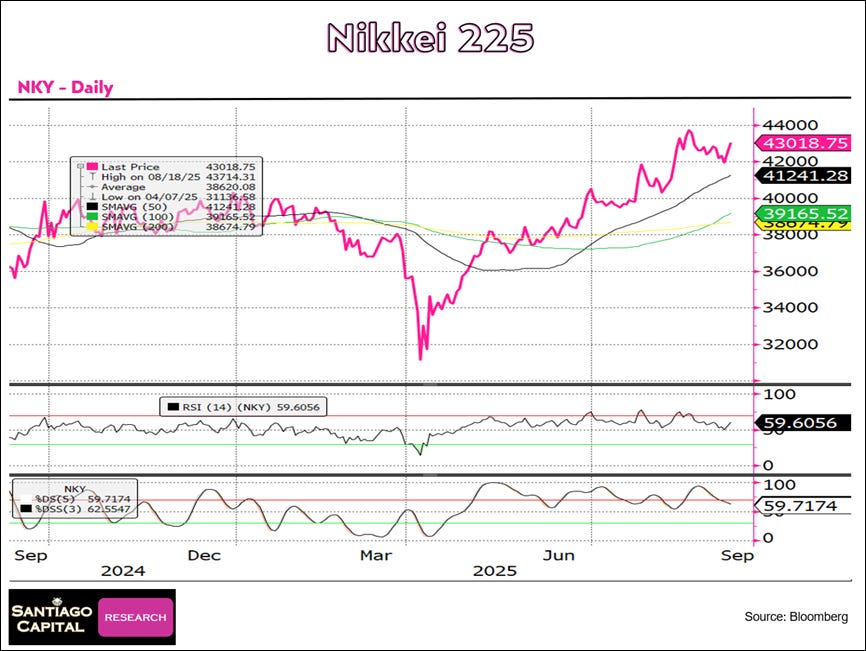
Nikkei 225 (NKY – Daily)
Price at 43,018.75, extended above all major moving averages.
RSI at 59.61, neutral and flat.
Stochastics at 59.72 / 62.55, neutral and flat.
Trend strong but consolidating.
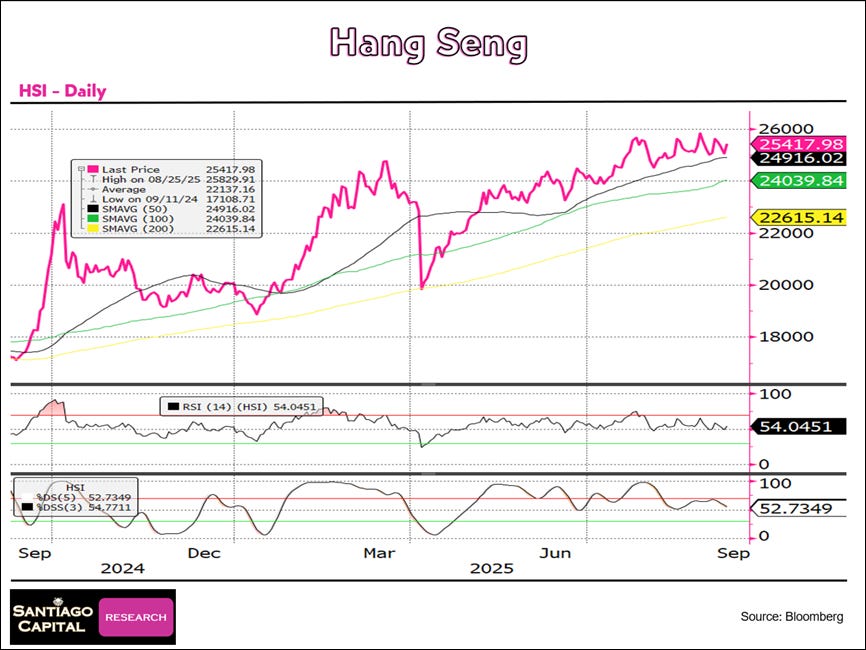
Hang Seng (HSI – Daily)
Price at 25,417.98, extended above all major moving averages.
RSI at 54.05, neutral and flat.
Stochastics at 52.73 / 54.77, neutral and flat.
Trend consolidating.
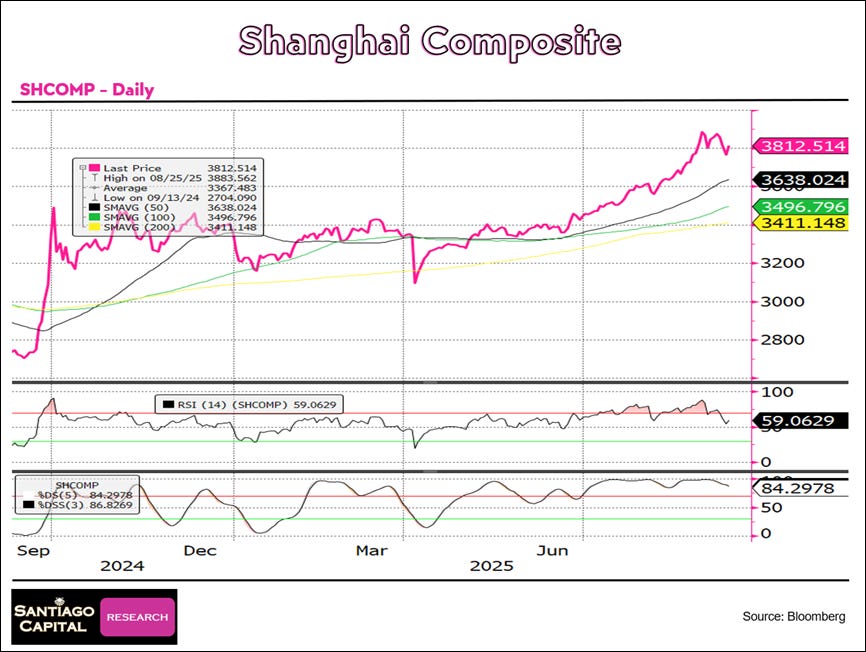
Shanghai Composite (SHCOMP – Daily)
Price at 3,812.51, holding above all major moving averages.
RSI at 59.06, neutral and falling.
Stochastics at 84.30 / 86.83, overbought and flat.
Trend weakening.
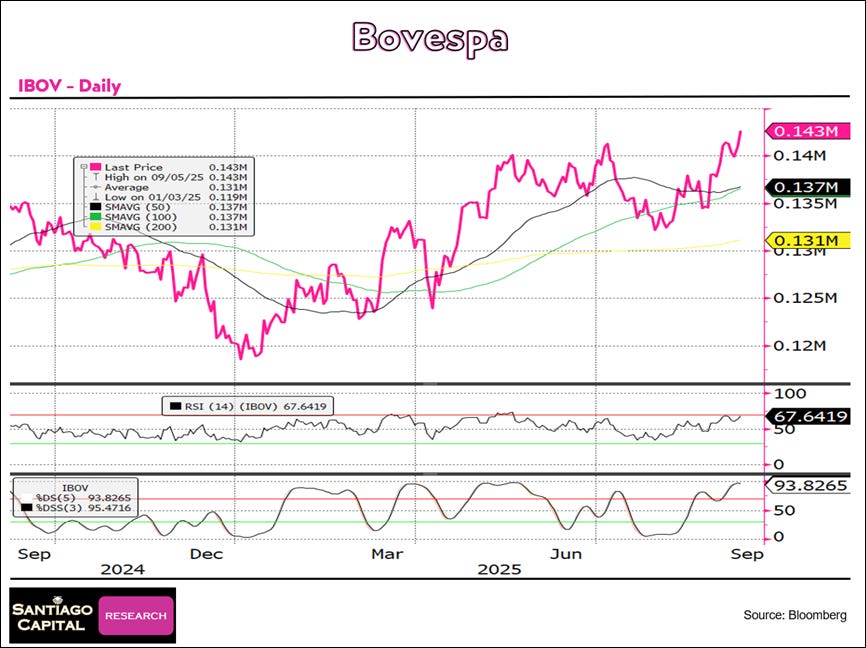
Bovespa (IBOV – Daily)
Price at 143,000, holding above all major moving averages.
RSI at 67.64, near overbought and flat.
Stochastics at 93.83 / 95.47, firmly overbought and flat.
Trend stretched.
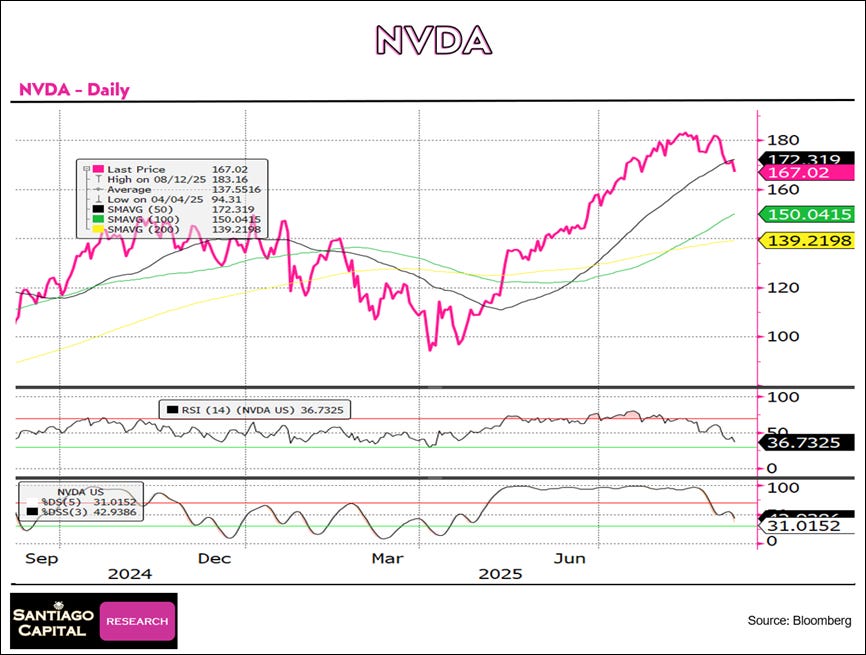
Nvidia (NVDA – Daily)
Price at 167.02, below the 50DMA but holding above the 100DMA and 200DMA.
RSI at 36.73, neutral and falling toward oversold.
Stochastics at 31.02 / 42.94, near oversold and falling.
Trend weakening.
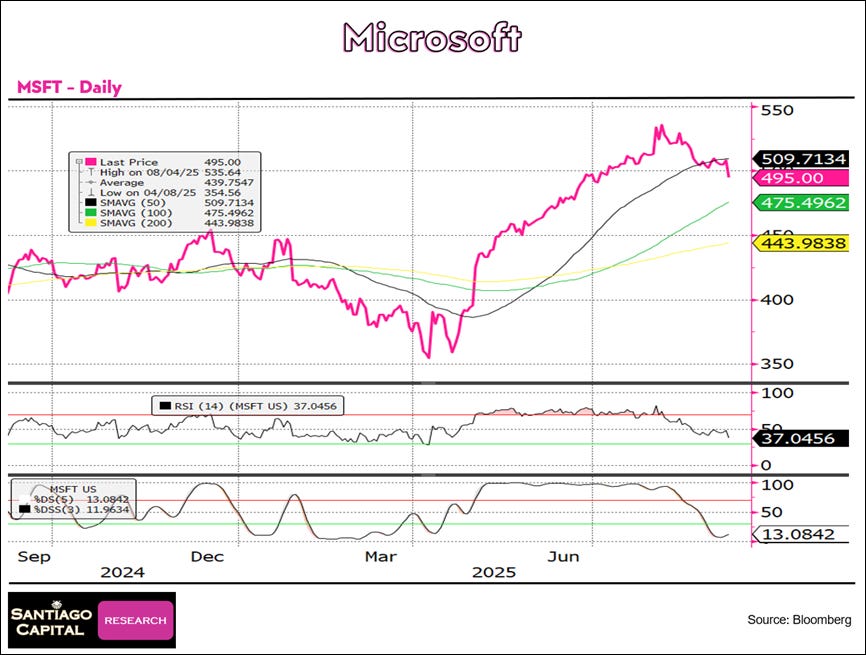
Microsoft (MSFT – Daily)
Price at 495.00, below the 50DMA but holding above the 100DMA and 200DMA.
RSI at 37.05, neutral and falling toward oversold.
Stochastics at 13.08 / 11.96, oversold and flat.
Trend weakening.
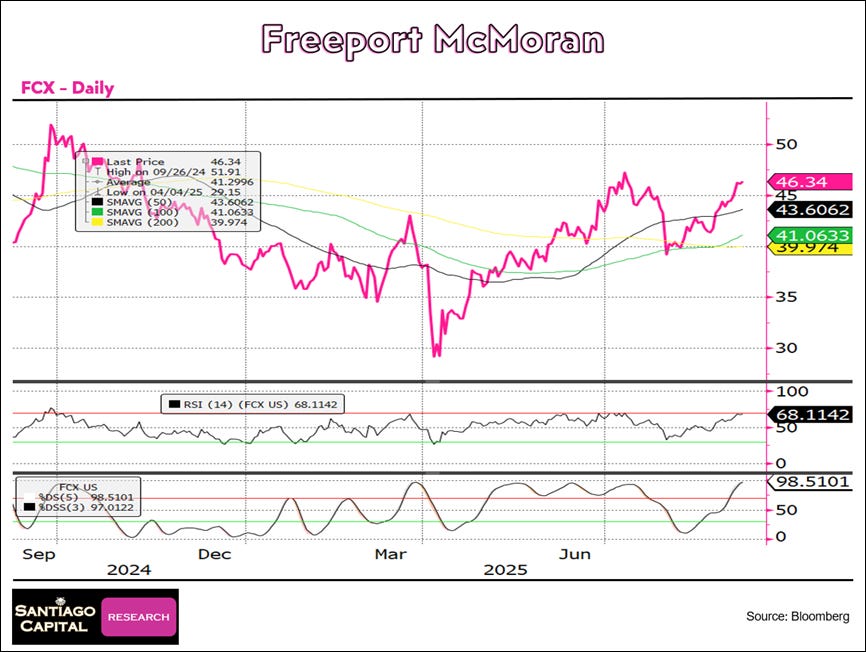
Freeport McMoRan (FCX – Daily)
Price at 46.34, above the 50DMA, 100DMA, and 200DMA.
RSI at 68.11, near overbought and rising.
Stochastics at 98.51 / 97.01, firmly overbought and rising.
Trend strong but stretched.
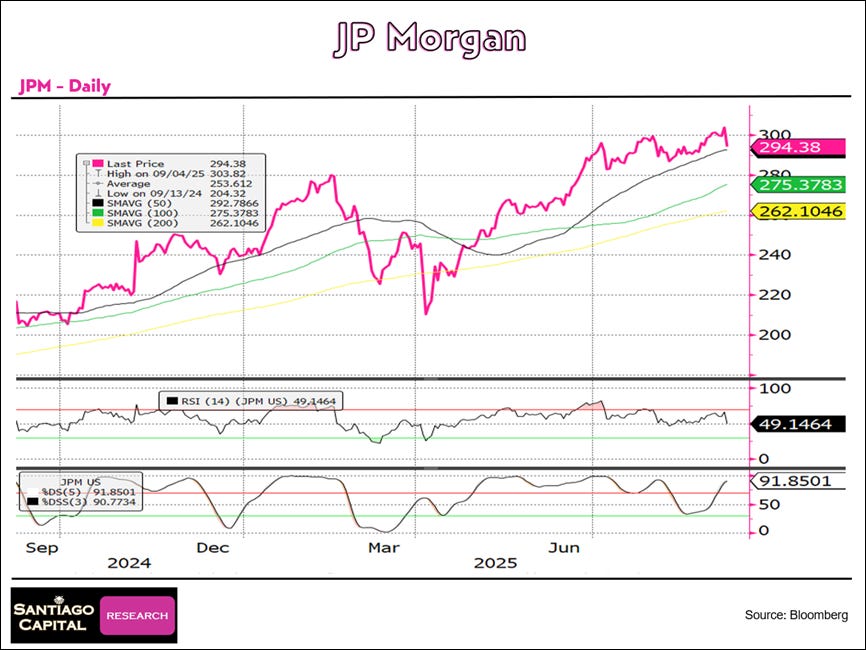
JP Morgan (JPM – Daily)
Price at 294.38, above all major moving averages, marginally above the 50DMA.
RSI at 49.15, neutral and flat.
Stochastics at 91.85 / 90.77, firmly overbought and rising.
Trend stretched and weakening.
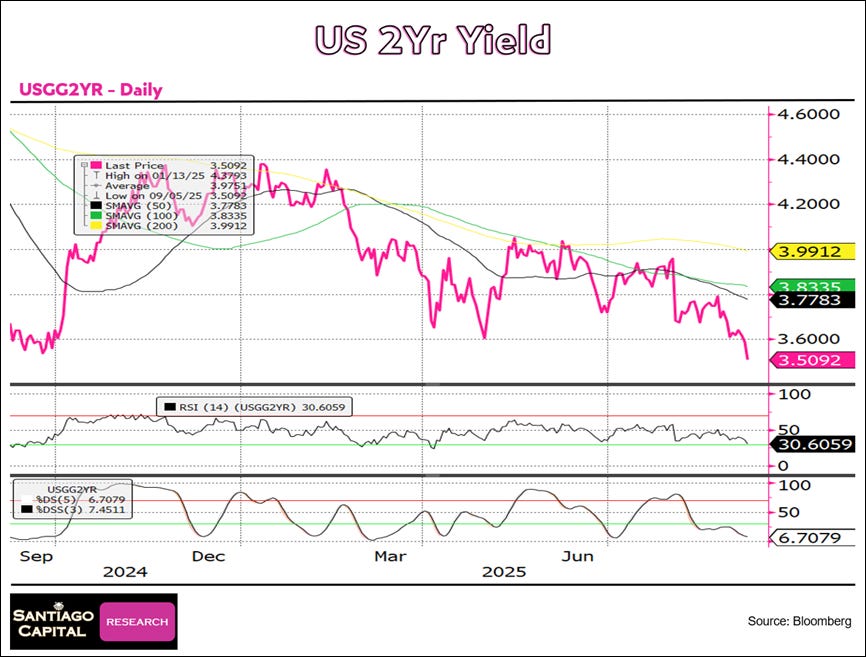
2Y UST
Price at 3.51, below the 50DMA, 100DMA, and 200DMA.
RSI at 30.61, near oversold and falling.
Stochastics at 6.71 / 7.45, firmly oversold and flat.
Trend weakening.
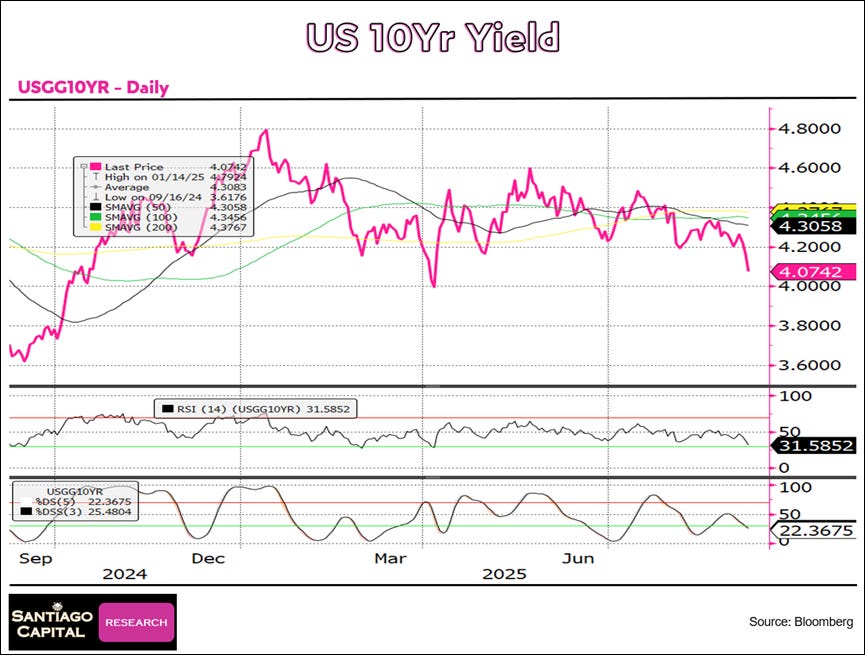
10Y UST
Price at 4.07, below the 50DMA, 100DMA, and 200DMA.
RSI at 31.59, near oversold and falling.
Stochastics at 22.37 / 25.48, oversold and flat.
Trend weakening.
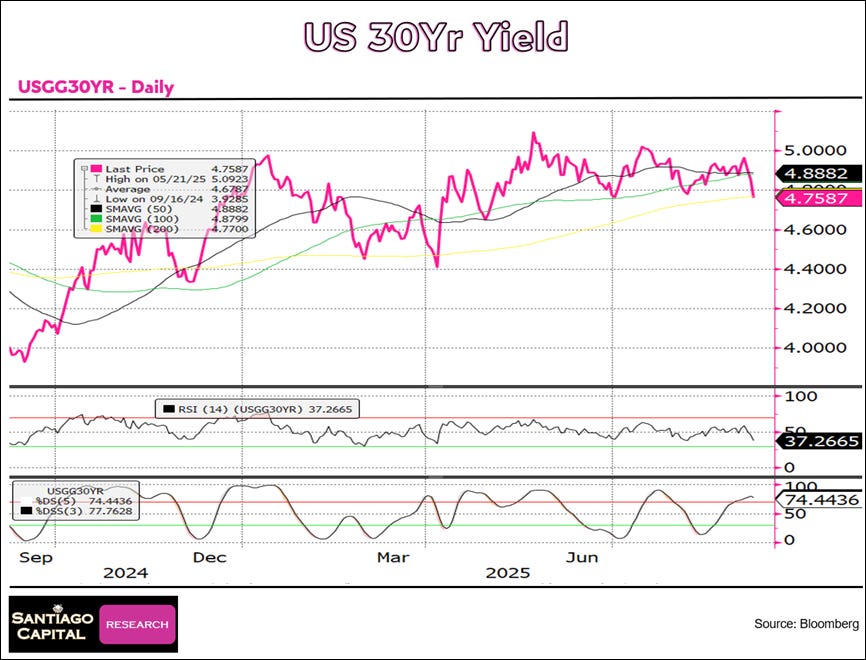
30Y UST
Price at 4.76, below the 50DMA but holding above the 100DMA and 200DMA.
RSI at 37.27, neutral and falling.
Stochastics at 74.44 / 77.76, near overbought and rising.
Trend weakening.
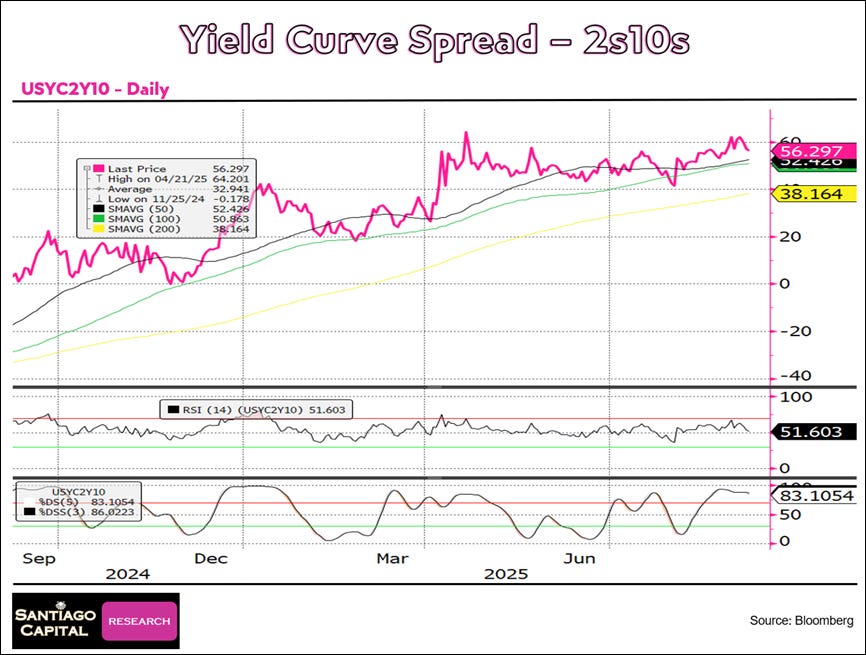
2s10s Spread
Price at 56.30, above the 50DMA, 100DMA, and 200DMA.
RSI at 51.60, neutral and flat.
Stochastics at 83.11 / 86.02, overbought and flat.
Trend consolidating.
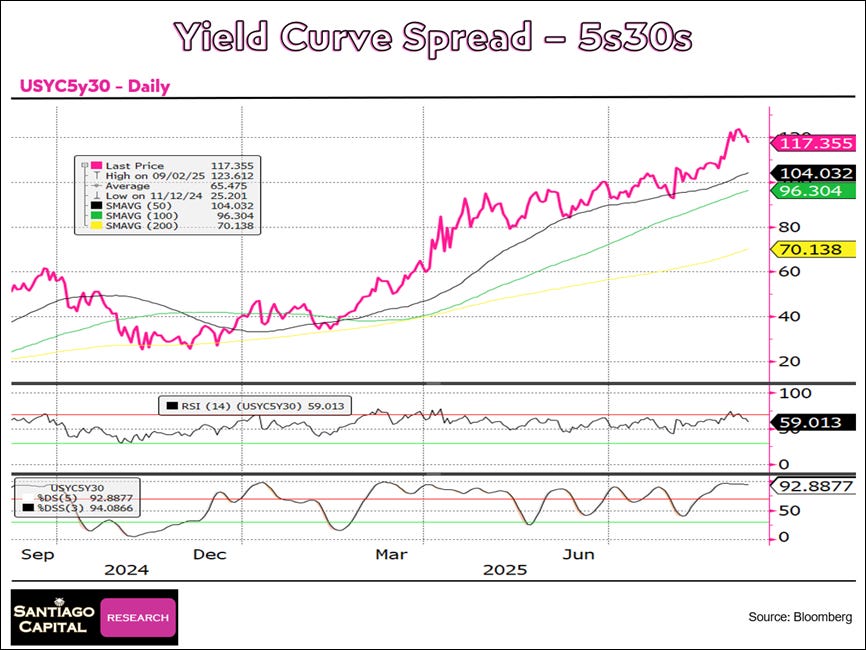
5s30s Spread
Price at 117.36, above the 50DMA, 100DMA, and 200DMA.
RSI at 59.01, neutral and rolling down.
Stochastics at 92.89 / 94.09, firmly overbought and rising.
Trend strong but stretched.
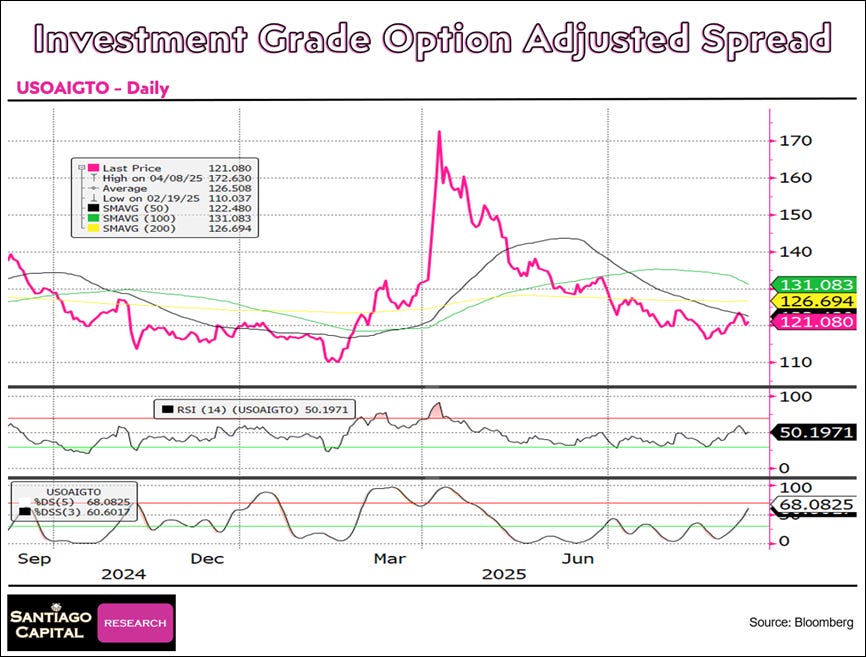
IG OAS
Price at 121.08, below the 50DMA, 100DMA, and 200DMA.
RSI at 50.20, neutral and flat.
Stochastics at 68.08 / 60.60, neutral and rising.
Trend consolidating.
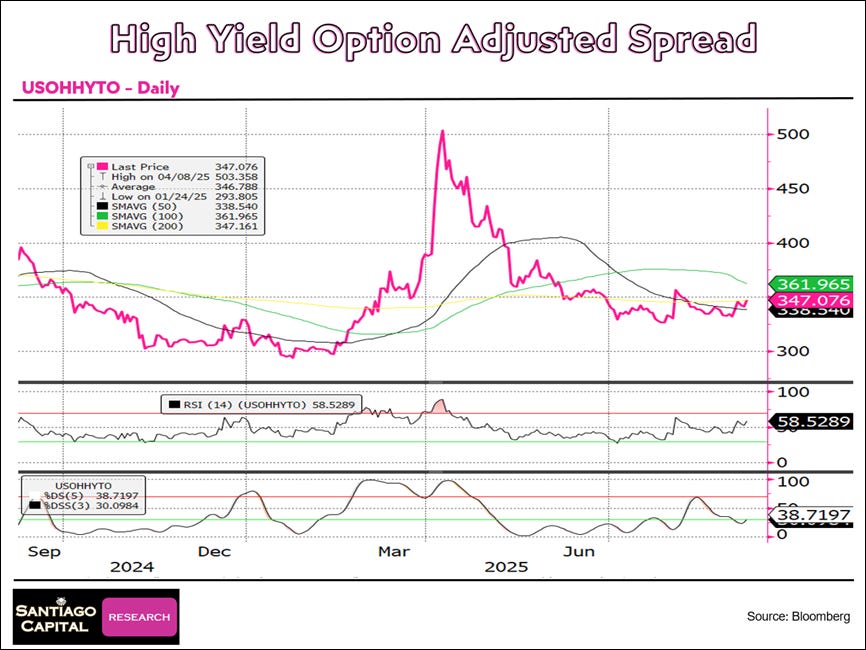
HY OAS
Price at 347.08, sitting just below the 100DMA but above the 50DMA and near the 200DMA.
RSI at 58.53, mid-range and pushing higher.
Stochastics at 38.72 / 30.10, rising from oversold territory.
Trend stabilizing with momentum improving after prior weakness.
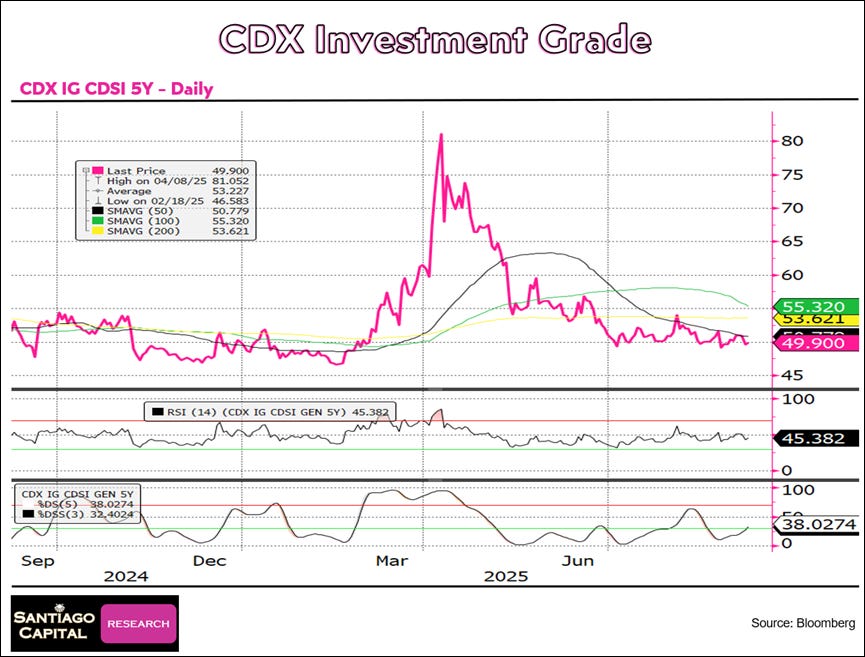
CDX IG 5Y
Price at 49.90, trading below the 50DMA, 100DMA, and 200DMA.
RSI at 45.38, mid-range and neutral.
Stochastics at 38.03 / 32.40, curling higher from oversold conditions.
Trend weak and subdued, with modest signs of basing but no clear momentum.
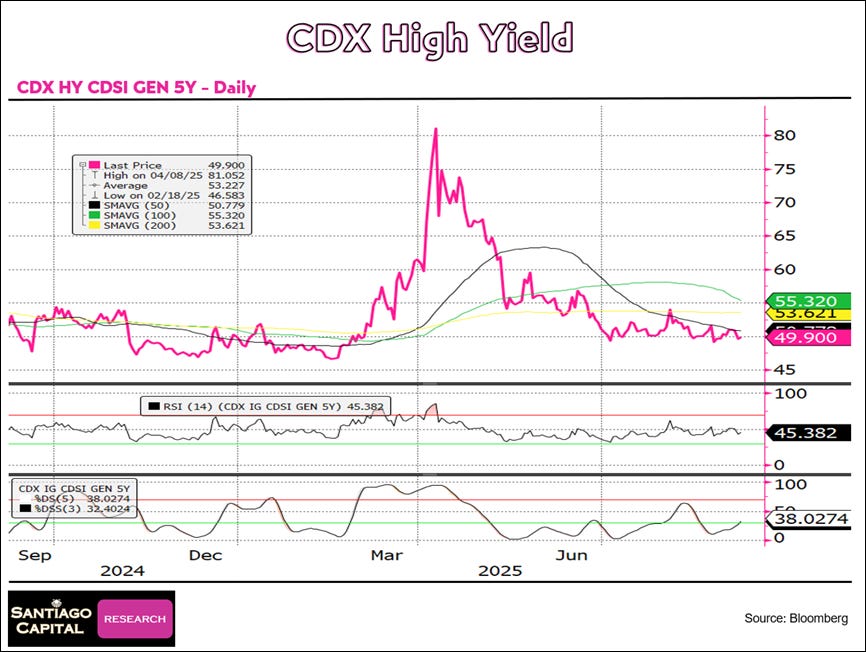
CDX HY 5Y
Price at 49.90, below the 50DMA, 100DMA, and 200DMA.
RSI at 45.38, neutral and flat.
Stochastics at 38.03 / 32.40, lifting slightly from oversold levels.
Trend weak and directionless, lacking momentum.
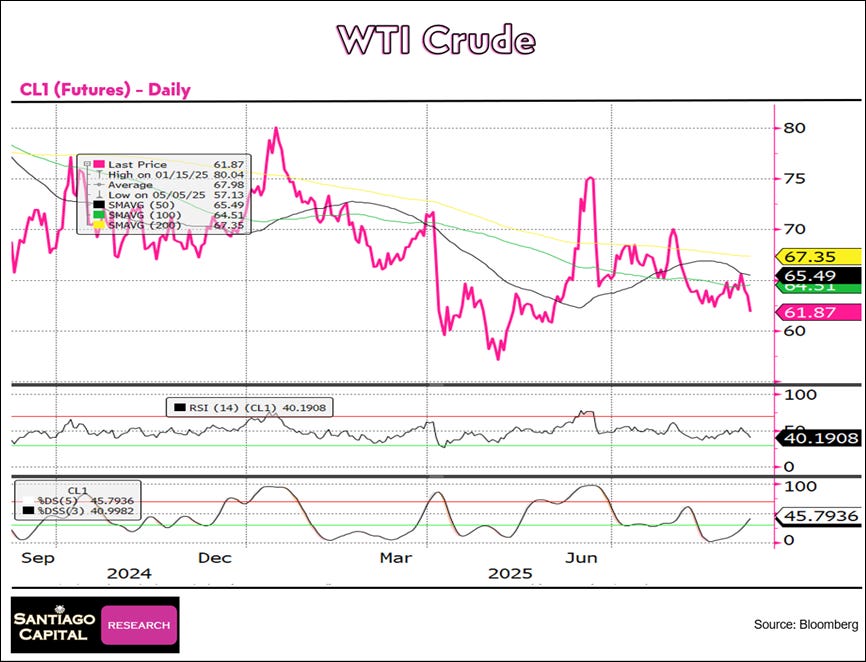
WTI Crude
Price at 61.87, below the 50DMA, 100DMA, and 200DMA.
RSI at 40.19, weak and leaning toward oversold.
Stochastics at 45.79 / 41.00, stabilizing in the lower range.
Trend bearish, under pressure with limited momentum.
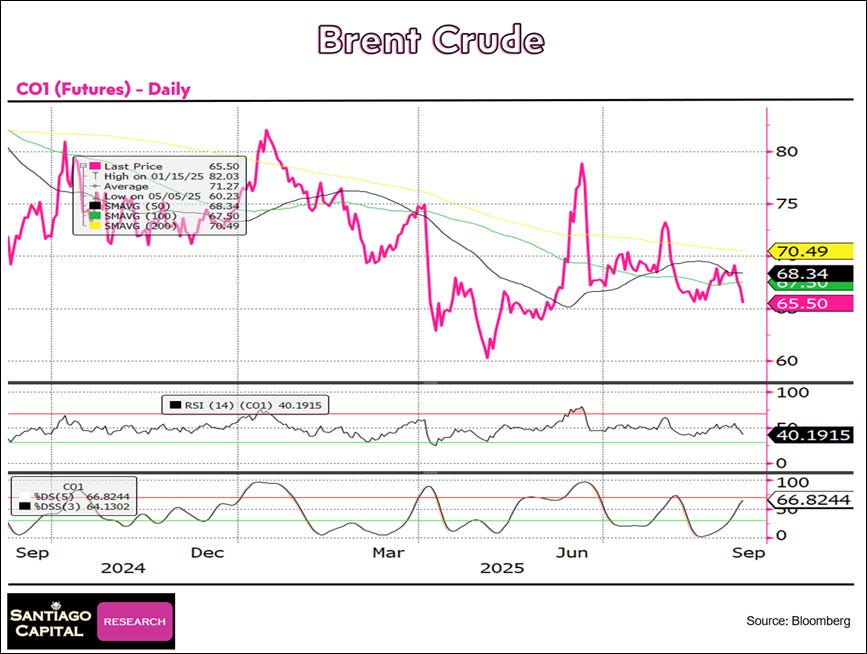
Brent Crude
Price at 65.50, below the 50DMA, 100DMA, and 200DMA.
RSI at 40.19, weak and near oversold levels.
Stochastics at 66.82 / 64.13, recovering into mid-range.
Trend bearish overall, with modest attempts at stabilization.
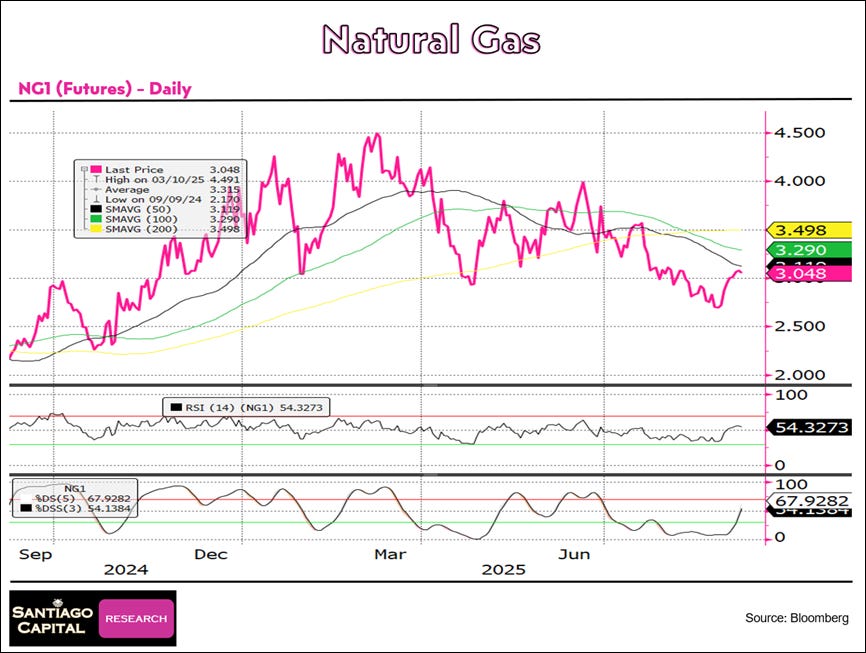
Natural Gas
Price at 3.05, below the 50DMA, 100DMA, and 200DMA.
RSI at 54.33, neutral with upward bias.
Stochastics at 67.93 / 54.14, lifting toward overbought territory.
Trend weak but attempting recovery from recent lows.
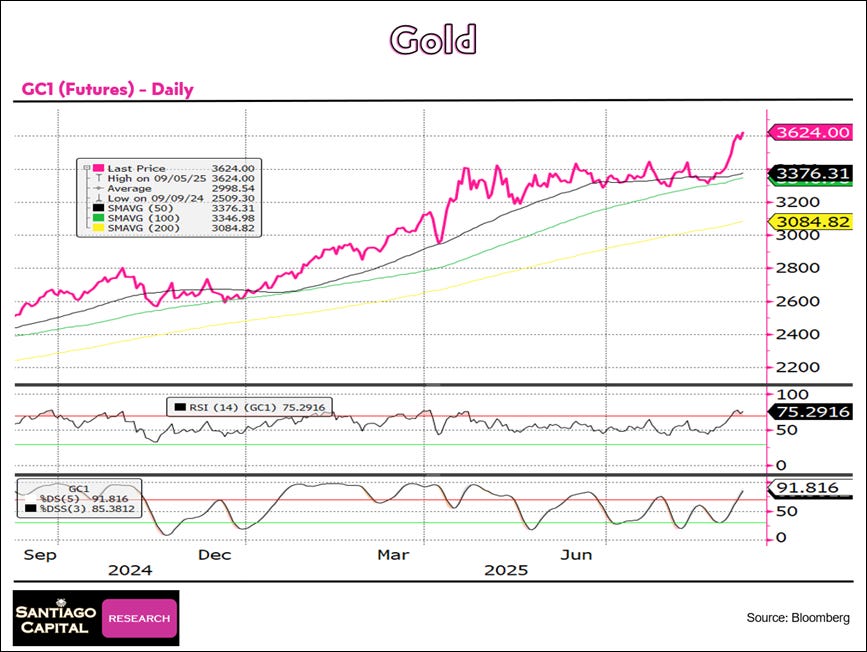
Gold
Price at 3624.00, well above the 50DMA, 100DMA, and 200DMA.
RSI at 75.29, overbought and rising.
Stochastics at 91.82 / 85.38, firmly overbought.
Trend strong and extended, showing powerful upside momentum.
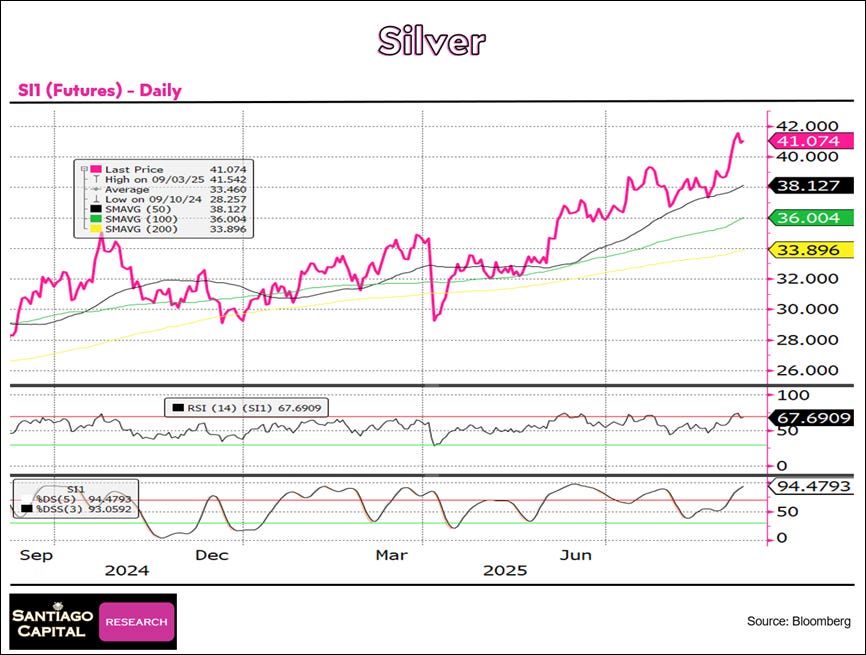
Silver
Price at 41.07, above the 50DMA, 100DMA, and 200DMA.
RSI at 67.69, nearing overbought and rising.
Stochastics at 94.48 / 93.06, firmly overbought.
Trend strong and extended, with bullish momentum dominating.
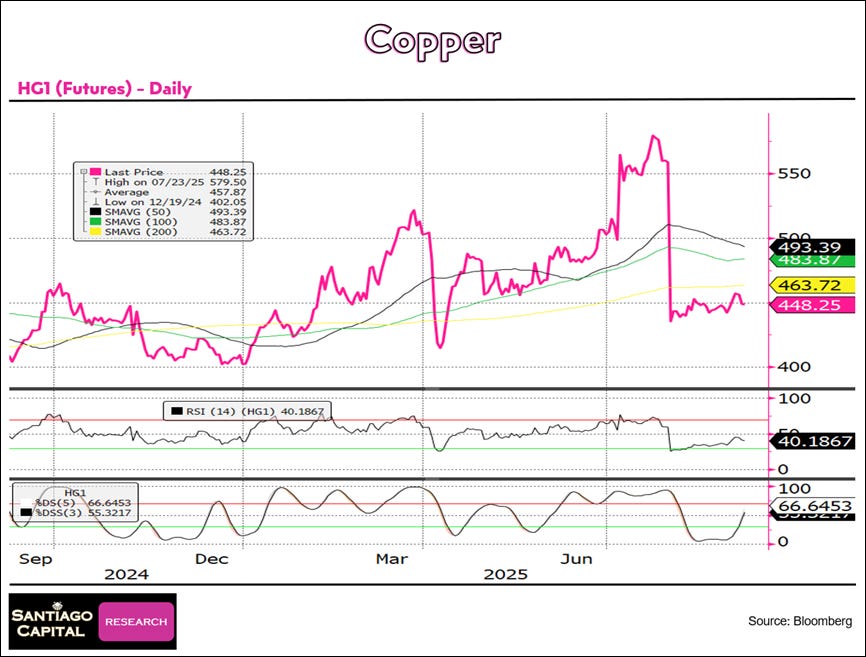
Copper
Price at 448.25, below the 50DMA, 100DMA, and 200DMA.
RSI at 40.19, weak and near oversold.
Stochastics at 66.65 / 55.32, turning higher from lower levels.
Trend bearish, consolidating after recent declines.
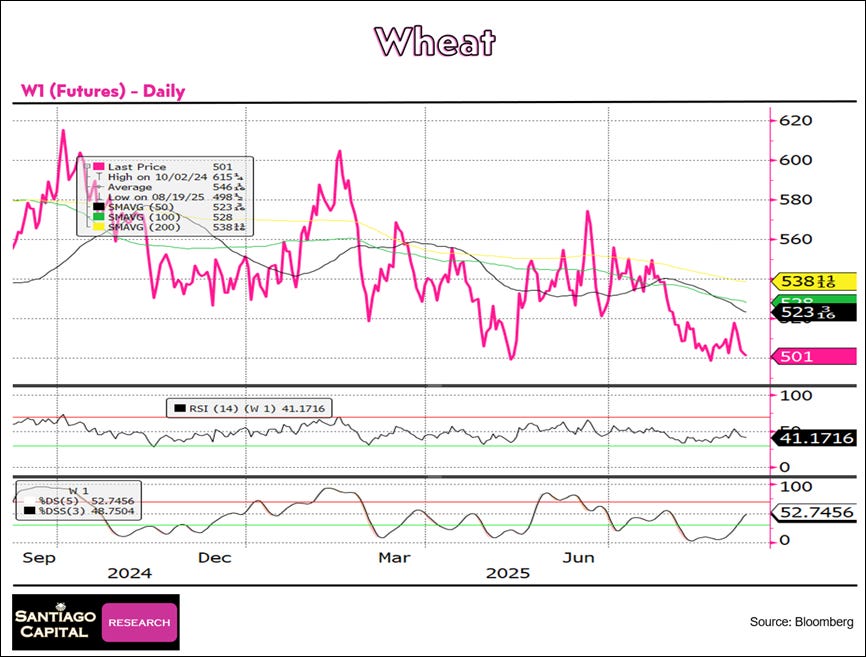
Wheat
Price at 501, below the 50DMA, 100DMA, and 200DMA.
RSI at 41.17, weak and leaning toward oversold.
Stochastics at 52.75 / 48.75, attempting to turn higher.
Trend bearish, under pressure with modest stabilization efforts.
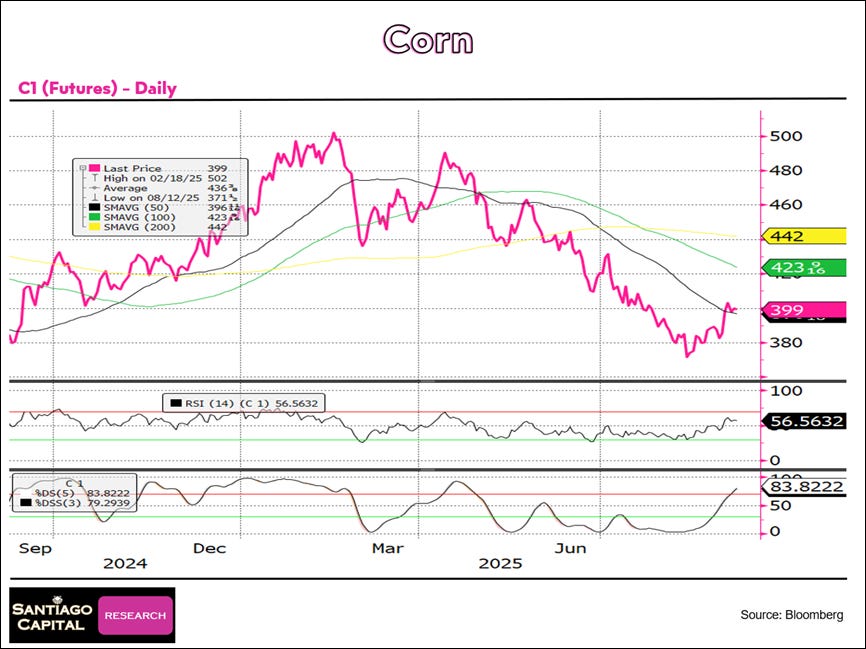
Corn
Price at 399, below the 100DMA and 200DMA but just above the 50DMA.
RSI at 56.56, neutral and rising.
Stochastics at 83.82 / 79.29, overbought and extended.
Trend attempting recovery, though momentum looks stretched.
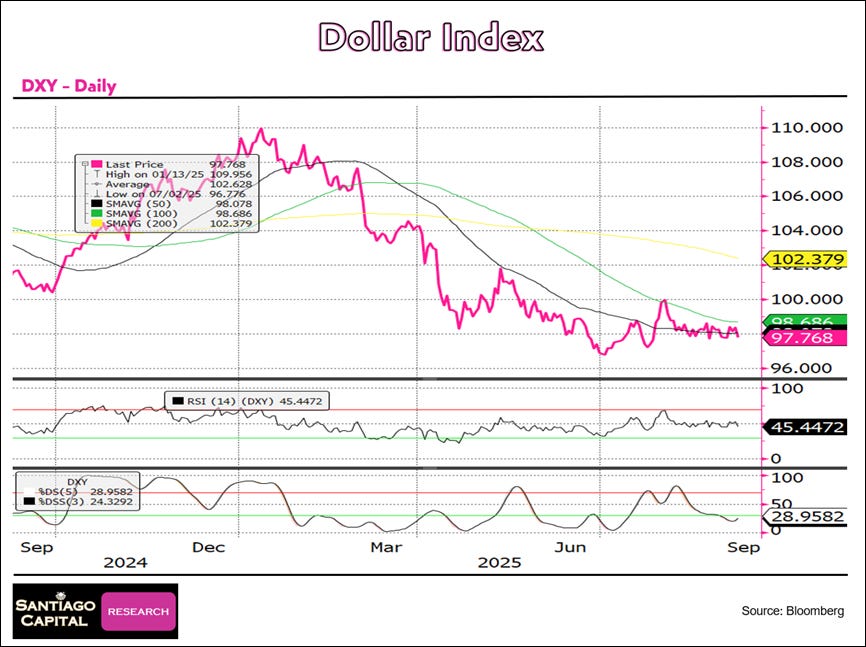
Dollar Index
Price at 97.77, below the 50DMA, 100DMA, and 200DMA.
RSI at 45.45, neutral and flat.
Stochastics at 28.96 / 24.33, near oversold.
Trend weak and consolidating after sustained decline.
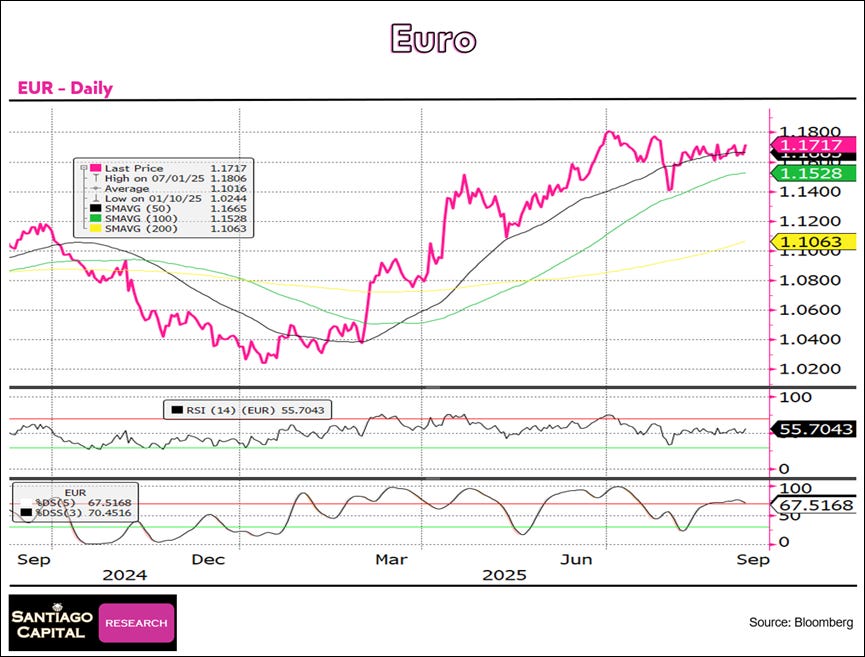
EURO
Price at 1.1717, above the 50DMA, 100DMA, and 200DMA.
RSI at 55.70, neutral with slight upward bias.
Stochastics at 67.52 / 70.45, pushing into higher range.
Trend strong and consolidating near recent highs.
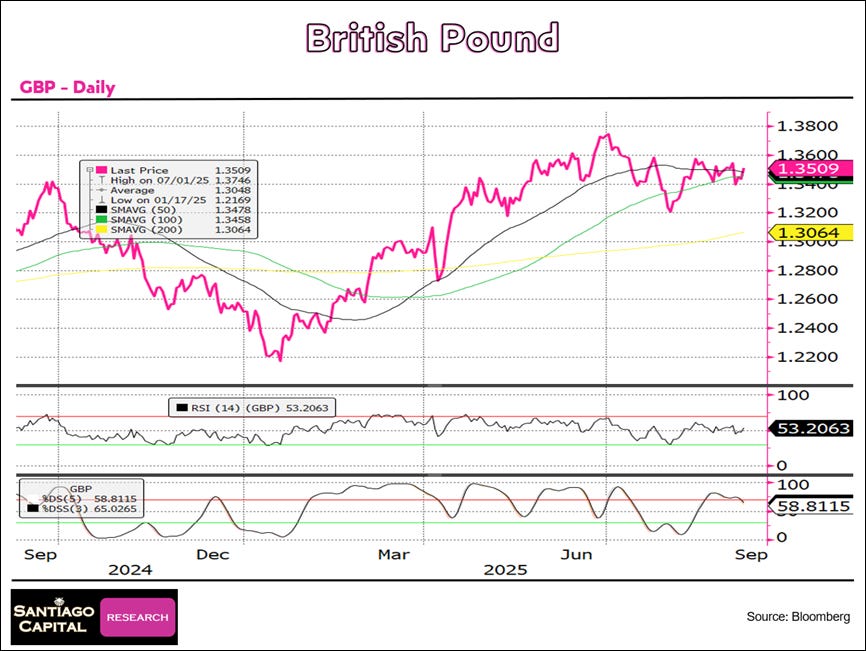
British Pound
Price at 1.3509, above the 50DMA, 100DMA, and 200DMA.
RSI at 53.21, neutral.
Stochastics at 58.81 / 65.03, mid-range and steady.
Trend firm, consolidating gains with balanced momentum.
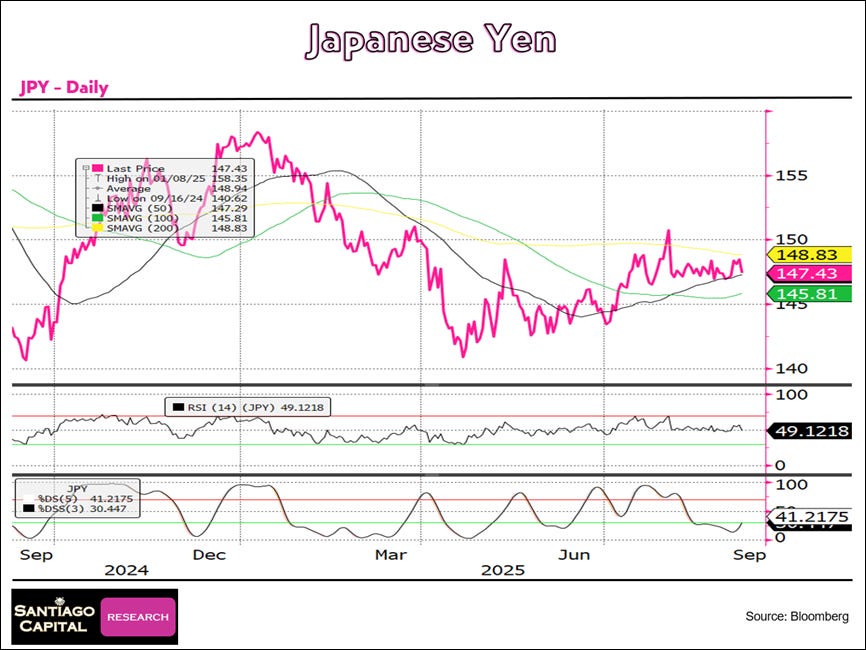
Japanese Yen
Price at 147.43, sitting near the 50DMA and 200DMA, slightly above the 100DMA.
RSI at 49.12, neutral.
Stochastics at 41.22 / 30.45, soft and drifting lower.
Trend flat, lacking momentum and direction.
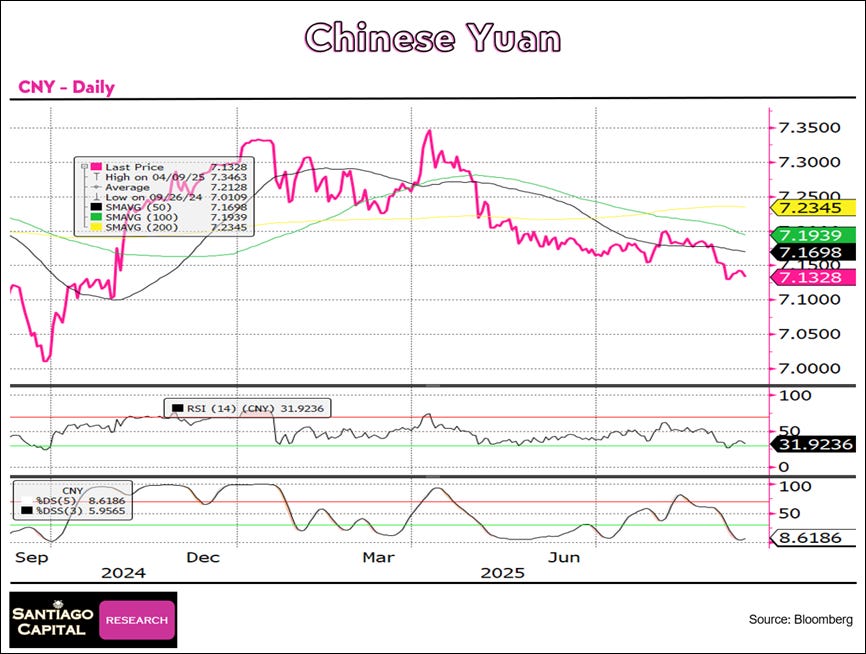
Chinese Yuan
Price at 7.1328, below the 50DMA, 100DMA, and 200DMA.
RSI at 31.92, weak and nearing oversold.
Stochastics at 8.62 / 5.96, deeply oversold.
Trend bearish, pressing lower with momentum extended.
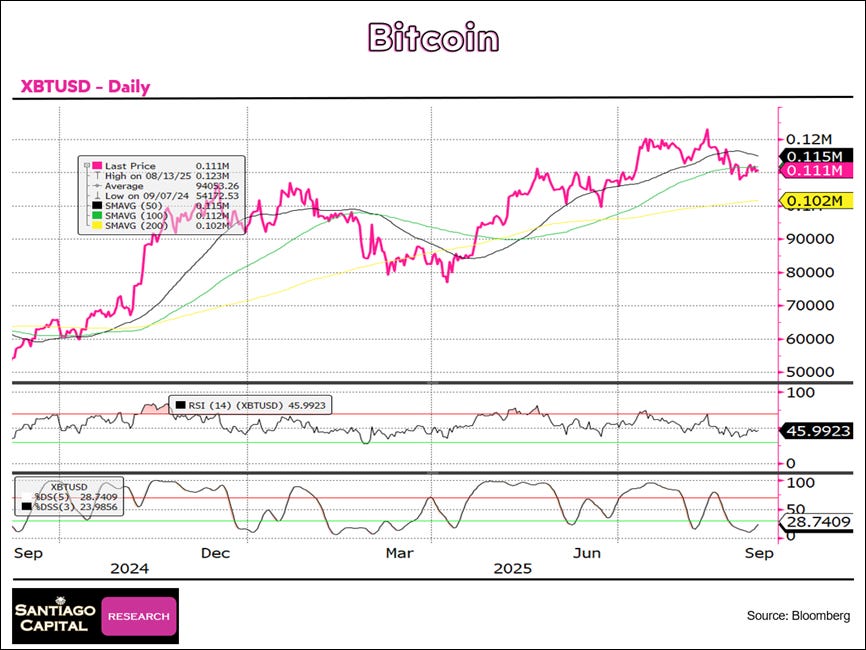
Bitcoin
Price at 111,000, below the 50DMA and 100DMA but above the 200DMA.
RSI at 45.99, neutral and flat.
Stochastics at 28.74 / 23.99, near oversold.
Trend consolidating, with downside pressure moderating above long-term support.
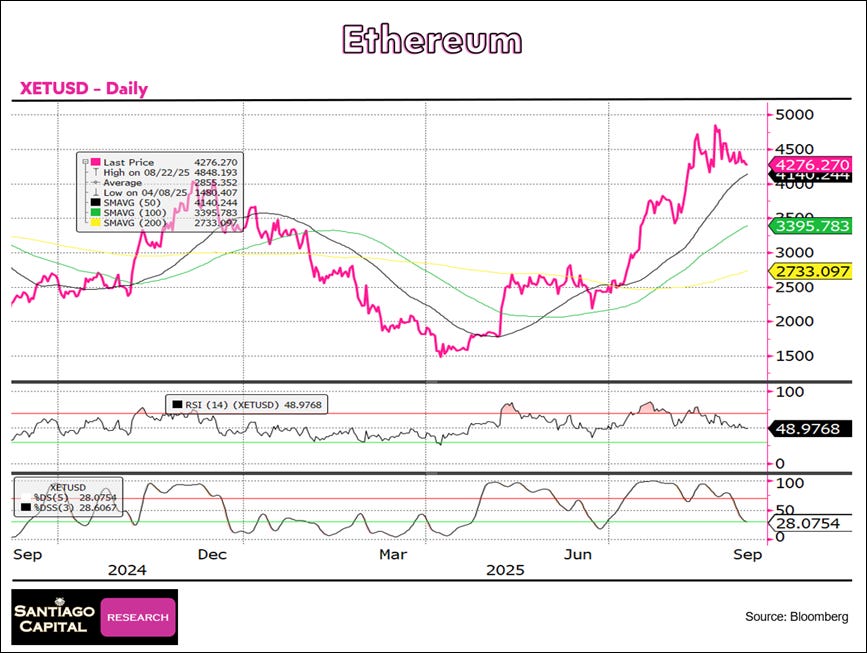
Ethereum
Price at 4276.27, above the 50DMA, 100DMA, and 200DMA.
RSI at 48.98, neutral.
Stochastics at 28.08 / 28.61, near oversold.
Trend strong overall but consolidating after recent highs.
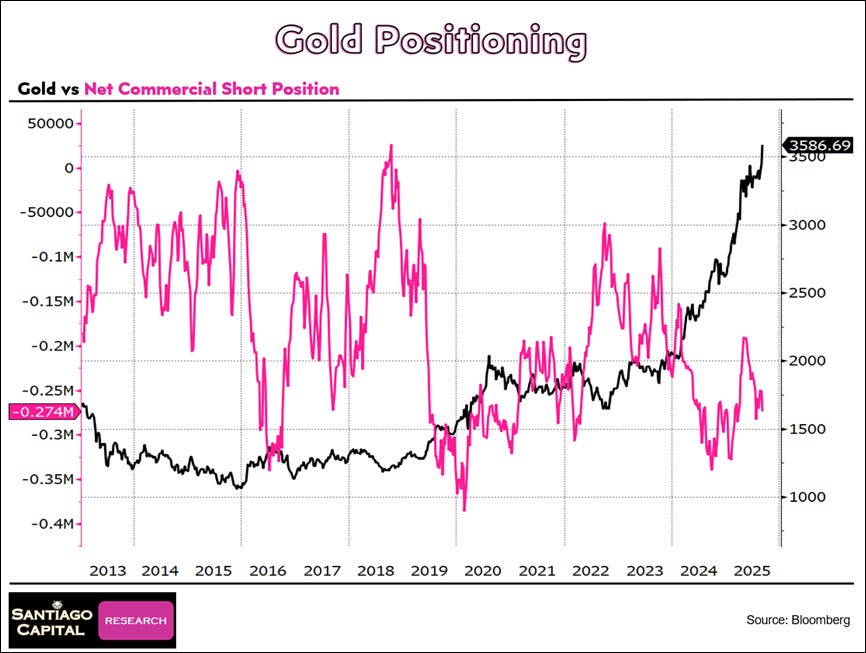
Gold positioning
Commercials are net short ~274K contracts, a historically heavy position.
Gold trades at 3,586.69, pushing to fresh record highs.
Record pricing paired with large commercial shorts has often preceded volatility.
Positioning implies risk of corrective pressure despite a strong bullish trend.
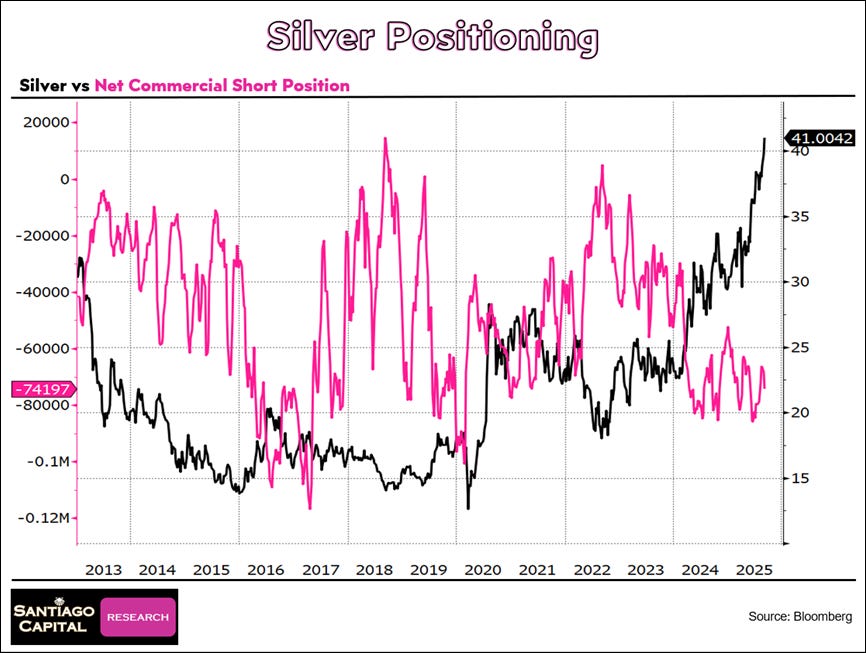
Silver positioning
Commercials are net short ~74K contracts, a significant but not extreme position.
Silver trades at 41.00, marking multi-year highs.
Strong prices coinciding with notable commercial shorts have historically preceded bouts of volatility.
Positioning indicates potential corrective risk, though the broader trend remains upward.
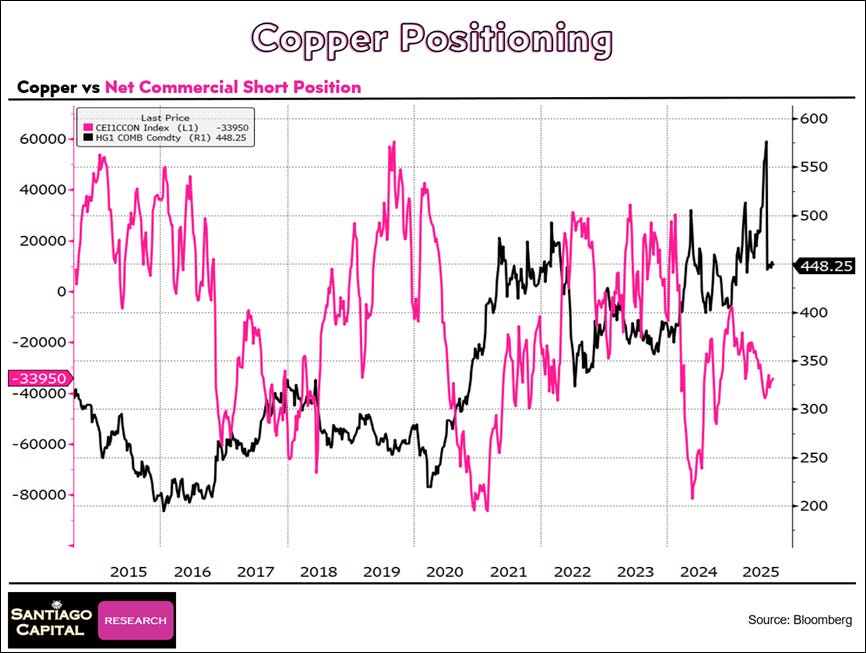
Copper positioning
Commercials are net short ~34K contracts, moderate relative to historical positioning.
Copper trades at 448.25, near the middle of its multi-year range.
Past episodes of commercial shorts at these levels have often coincided with choppy trade and volatility.
Positioning suggests balanced but cautious outlook, with no extreme signal either way.
The Week Ahead
The calendar ahead is again packed with data and events that will serve as fresh tests of the market’s ability to navigate a policy environment where Central Bankers are rewriting their models as we move forward in time.
Monday, September 8 – U.S. Consumer Credit (July) and Japan Q2 GDP (final) — Fed officials and global investors will watch consumer borrowing trends in the U.S. and Japan’s GDP data for signs of spending resilience or slowdown.
Wednesday, September 10 – U.S. Producer Price Index (August) — an inflation barometer that could influence expectations for Fed easing.
Thursday, September 11 – U.S. Consumer Price Index (August, final), Treasury Monthly Statement, and ECB Policy Decision — markets will focus on whether broad inflation persists, U.S. Treasury supply adjusts, and whether the ECB signals policy direction.
Friday, September 12 – University of Michigan Consumer Sentiment (September preliminary) — gauges household confidence ahead of next week’s key Fed decision.
The coming week offers no shortage of catalysts.
Inflation readings in the U.S. will provide the final test before the Fed meets again, forcing investors to weigh whether the slowdown in labor is matched by relief on prices.
The ECB’s decision will be judged against the backdrop of producer cost pressures, with any shift in tone carrying currency implications.
Japan’s GDP release and U.S. consumer sentiment add further texture, rounding out a week that will challenge markets to navigate diverging policy paths with little margin for error.
“Markets are constantly in a state of uncertainty and flux, and money is made by discounting the obvious and betting on the unexpected.”— George Soros
🔴 Stay ahead in minutes, not hours. Subscribe to A Macro Pilgrim’s Ledger – The Santiago Way for just $39/month and get these market insights delivered every Sunday.


